main logo
Neutron Imaging
Oak Ridge National Laboratory
  • Home
  • Before arriving
  • Capabilities
  • Software
  • Tutorials
    • Connect to our computers
    • Access your data
    • Start the python notebooks
    • Run a jupyter notebook
    • Use locally the imaging notebooks
    • eLog – beamline notebook
    • Bragg edge strain mapping
    • Imaging Notebooks
      • Bin pixels
      • Bragg edge
        • Bragg edge profile
        • Bragg edge – raw sample and powder
        • Bragg edge peak fitting evaluation
        • Bragg edge normalization
        • Bragg edge – normalized sample and powder
        • iBeatles strain mapping ASCII loader
        • List the Bragg edges of an element
      • Calibrated transmission
      • Combine
        • Combine all images selected
        • Combine images without outliers
        • Combine images sequentially using the metadata
        • Combine images n by n
        • Combine folders
      • Create list of file names vs time stamp
      • Cylindrical Geometry Correction with Embedded Widgets
      • Deal images
      • Display
        • Display integrated images
        • Display file name vs time stamp
        • Display counts of ROI vs stack
        • Display and export images with metadata profile
        • Display and export images with timestamps
      • Extract
        • Extract evenly spaced files
        • Extract NeXus DASlogs
      • Fix images
      • Fix images with negative pixels
      • From attenuation to concentration
      • From .dsc time info to ASCII file vs time
      • Group images by cycles for grating experiment
      • Group images per cycle for panoramic stitching
      • HFIR reactor element analysis tool
      • iBeatles
        • iBeatles strain mapping ASCII loader
        • iBeatles strain mapping HDF5 loader
      • Images and metadata extrapolation matcher
      • Integrated ROI counts vs file name and time stamp
      • List element Bragg edges
      • List metadata and time with ONCat
      • List TIFF metadata
      • Match images shapes
      • Math with images
      • MCP chips corrector
      • Metadata ASCII parser
      • Metadata overlapping images
      • Normalization
        • manual normalization
        • Automatic Normalization
        • Normalization TOF
      • Outliers filtering tool
      • Overlay images
      • Panoramic Stitching
        • Panoramic stitching for TOF
        • Panoramic stitching for white beam
      • Profile
        • Bragg edge profile
        • Circular profile of a ring
        • Linear profile
        • Radial profile
      • Registration
        • Automatic Mode
        • Manual Mode
        • Markers Mode
        • Profiler Mode
      • Rename files
      • ROI
        • ROI selection tool
        • ROI statistics vs stack
      • Rotate and crop images
      • Scale overlap images
      • Shifting time offset
      • Table of contents
      • Template UI builder
      • Timepix3
        • Timepix3 – Event HDF5 He3 Detector
        • Timepix3 – from event to histo NeXus
        • Timepix3 – Histogram HDF5 MCP Detector
      • VENUS notebooks
        • VENUS chopper T0 monitor counts
        • VENUS list of NeXus with pc above threshold
        • VENUS monitor NeXus (hdf5)
        • VENUS – Display metadata from HDF5
      • Water intake Profile Calculator
      • Wave front dynamics
    • CT reconstruction
      • CT reconstruction notebook (with embedded widgets)
      • Laminography
    • Standalone applications
      • Angel
      • iBeatles
      • maverick
        • maverick – GUI
        • maverick – CLI
    • Work with AMIRA
    • iNEUIT
      • Neutron transmission
      • Neutron resonance
      • Composition converter
      • Time-of-flight plotter
      • Bragg-edge simulator
      • Golden angles
      • From XRD to Bragg peaks position
    • Use ONCat
  • Gallery
  • Publications
  • FAQ
  • Contacts
  • Internal

How to access your data

  • Step 1: request access to our computer

    1 – Create an XCAMS account.

    IPTS access

    2 – Request access to HFIR and/or SNS data

    WARNING: If link does not work


  • Step 2: reach your data

    You have the option to work with your data on the analysis computer (recommended method) but you can also copy your data to your local machine. To do so you have a few options:
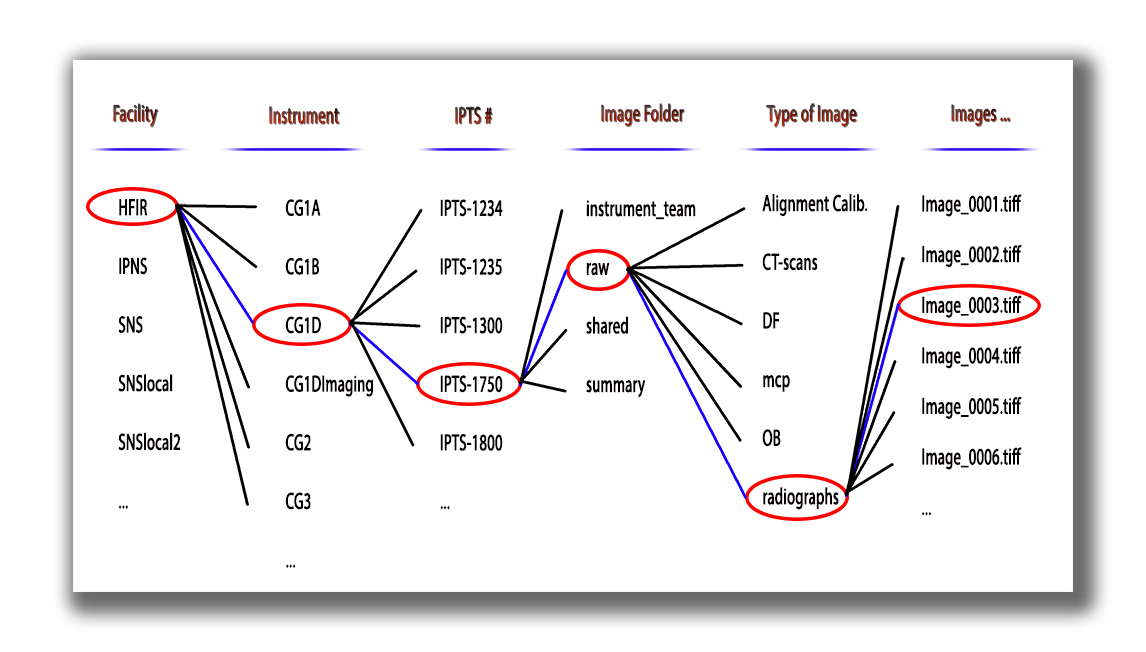
    • Filezilla
    • ONCat

    File structure

    If you get lost in the file system, here is a typical map of the file structure

    file structure


Oak Ridge National Laboratory is managed by UT-Battelle for the US Department of Energy
Privacy | Accessibility/508 | Nondiscrimination/1557