iBeatles strain mapping HDF5 loader
Description
This notebook takes the HDF5 created by iBeatles (strain mapping) and will display the lambda_hkl, d-spacing, and strain mapping with various interpolation algorithm options. In addition, the strain mapping can also be displayed on top of the sample projection.
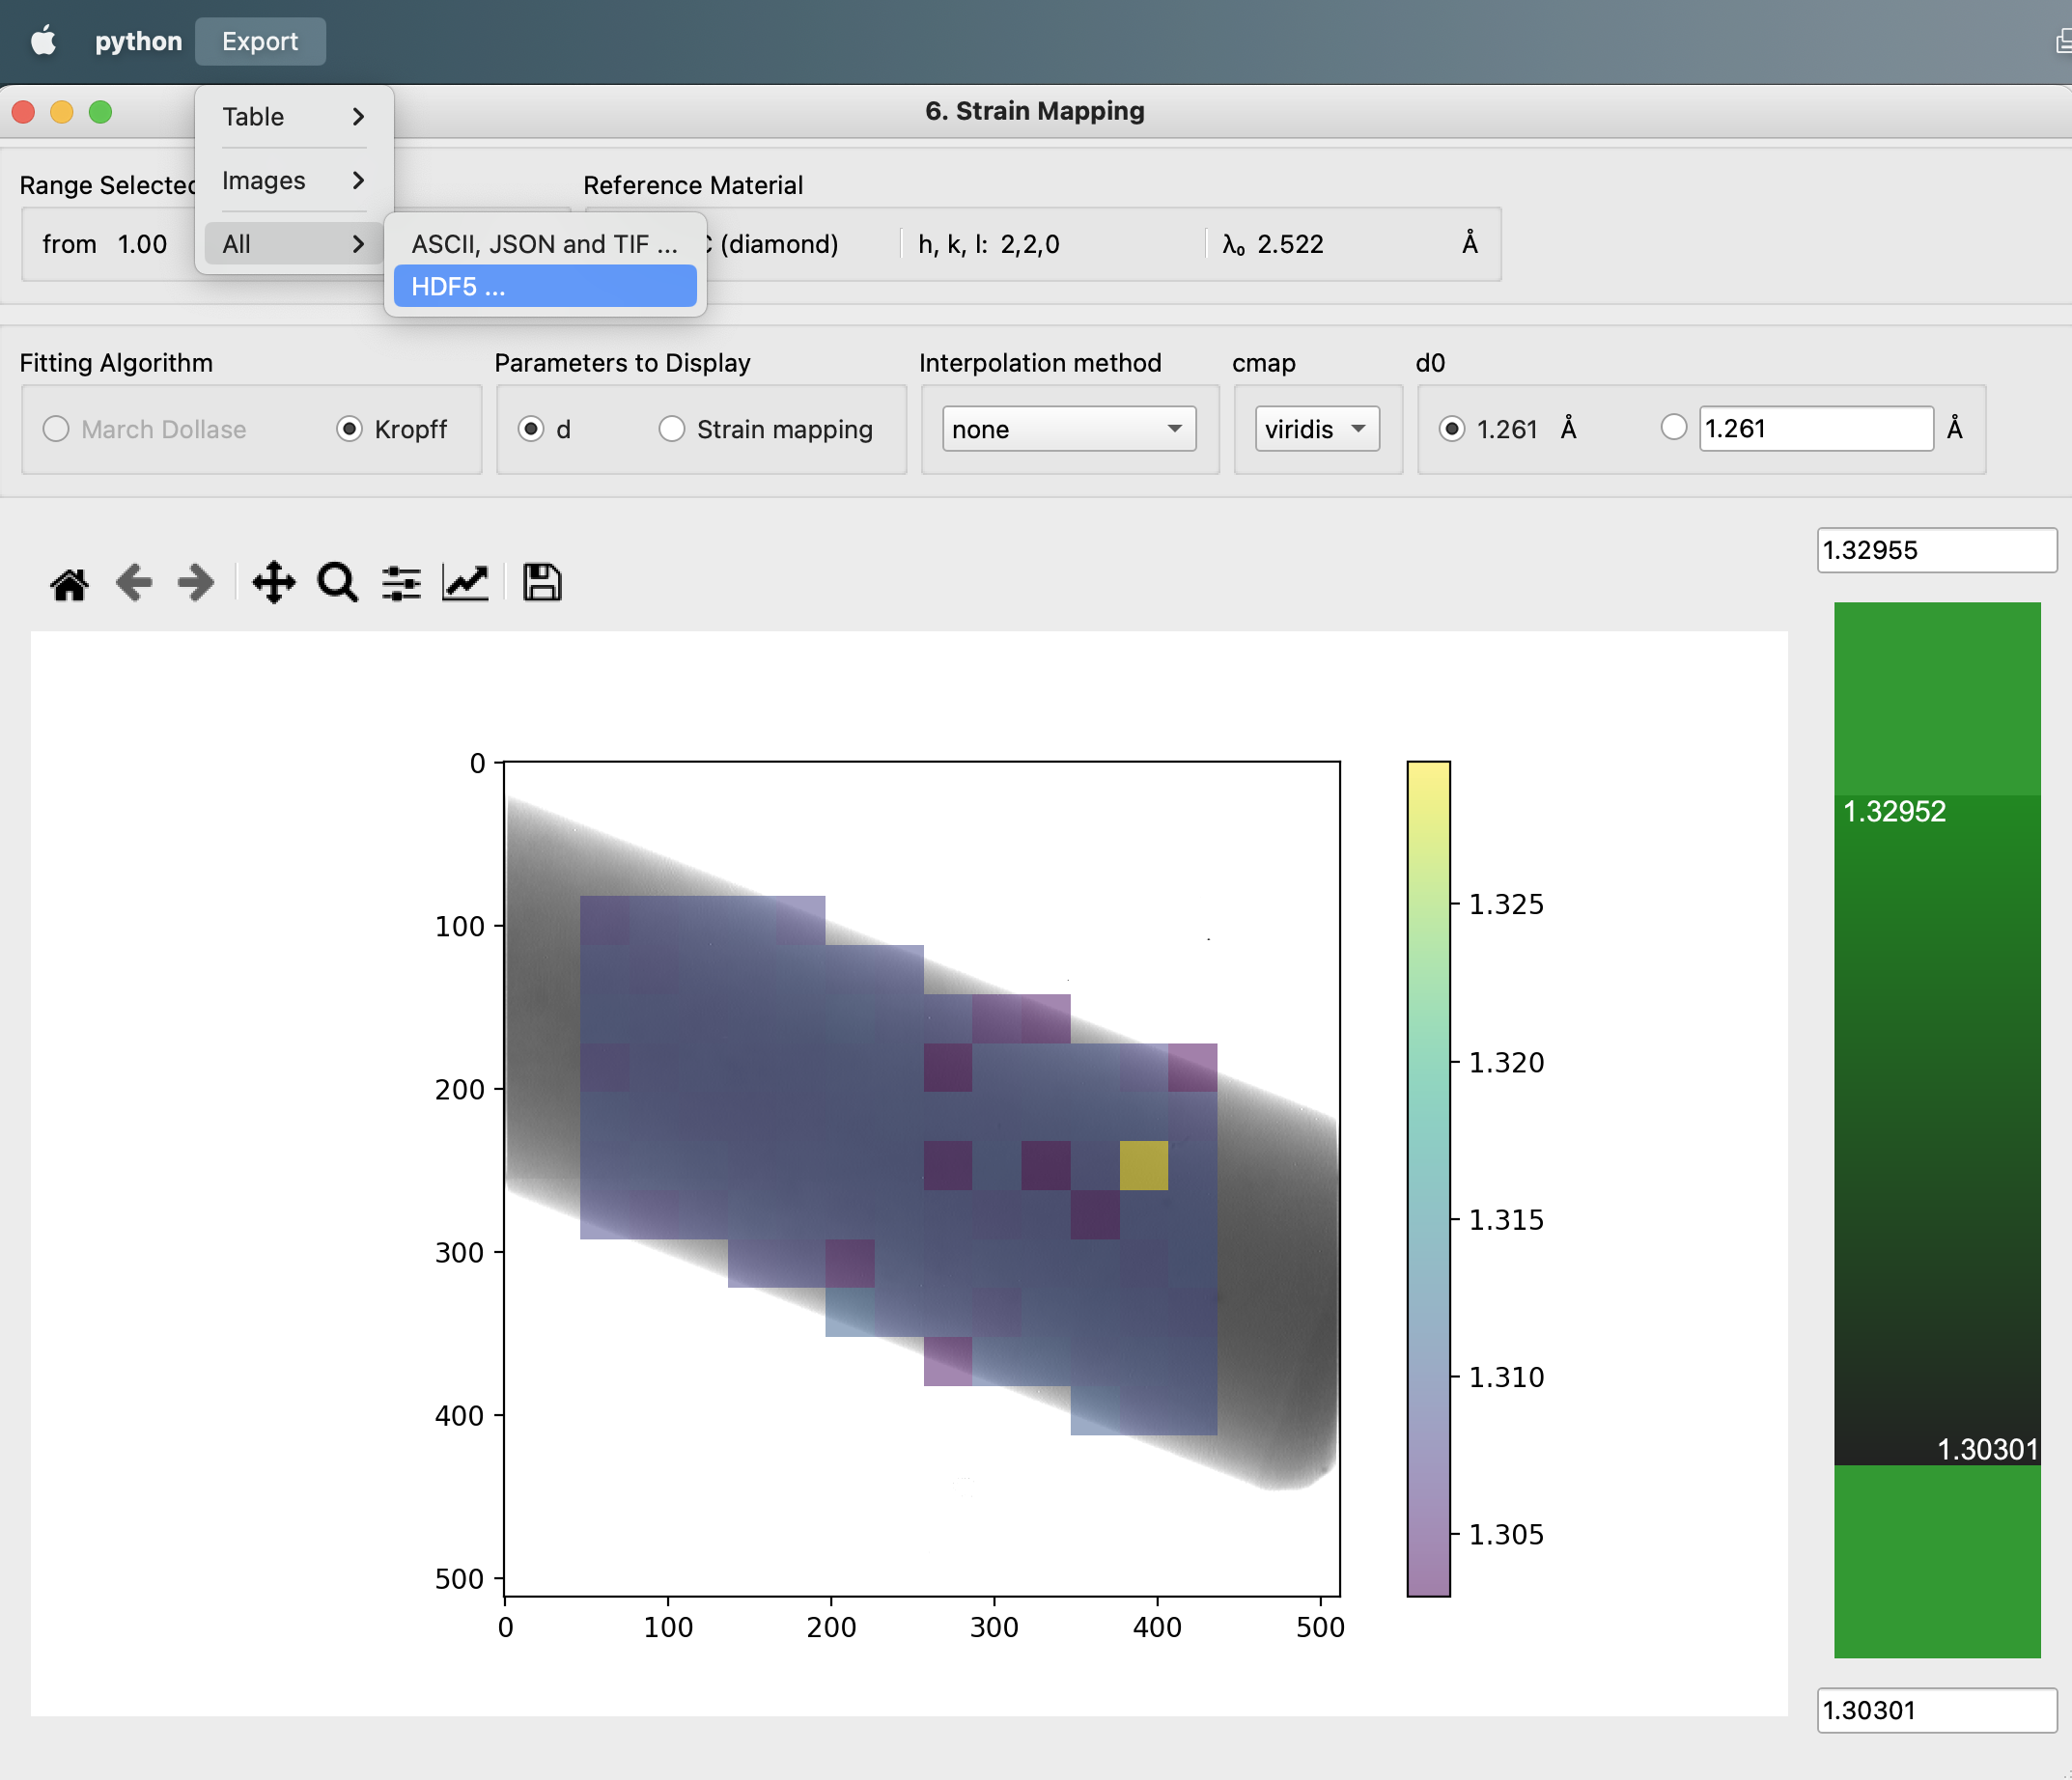
The screenshot shows where to reach the menu to export the HDF5.
Tutorial
Step by Step
Select your IPTS
Need help using the IPTS selector?
Select the HDF5 file table created by iBeatles (strain mapping step)
Using the file selection tool, select the HDF5 file you want to work with. The notebook will automatically load
- the integrated image of the sample (integrated over the time of flight range (TOF))
- the 2d arrays (d_spacing, lambda_hkl and strain_mapping)
- some metadata
- bin size
- distance source-detector
- detector offset
- d0
- material name
- hkl_value selected
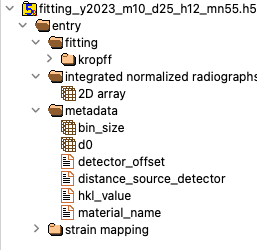
Figure showing a preview of HDF5 as displayed by HDFView
Display data
This is where the lambda, d, and strain mapping 2D array will be displayed. Users have the option to change the range displayed for each plot (min and max values, as well as the colormap (Viridis or jet).
Display strain mapping and sample
This cell will allow you to display the strain mapping with various interpolation options and colormaps on top of the sample.