ROI statistics vs stack
Description
Notebook to display and export statistics of the region of interest selected (ROI) over all images loaded.
Tutorial
Select your IPTS
Need help using the IPTS selector?
Select a folder of images to process
Using the folder selection tool, select the folder containing the data to load. All the data, of the most dominant extension, will be loaded when launching the user interface, in the next step.
UI tutorial
Run the next cell to launch the UI.
ROI
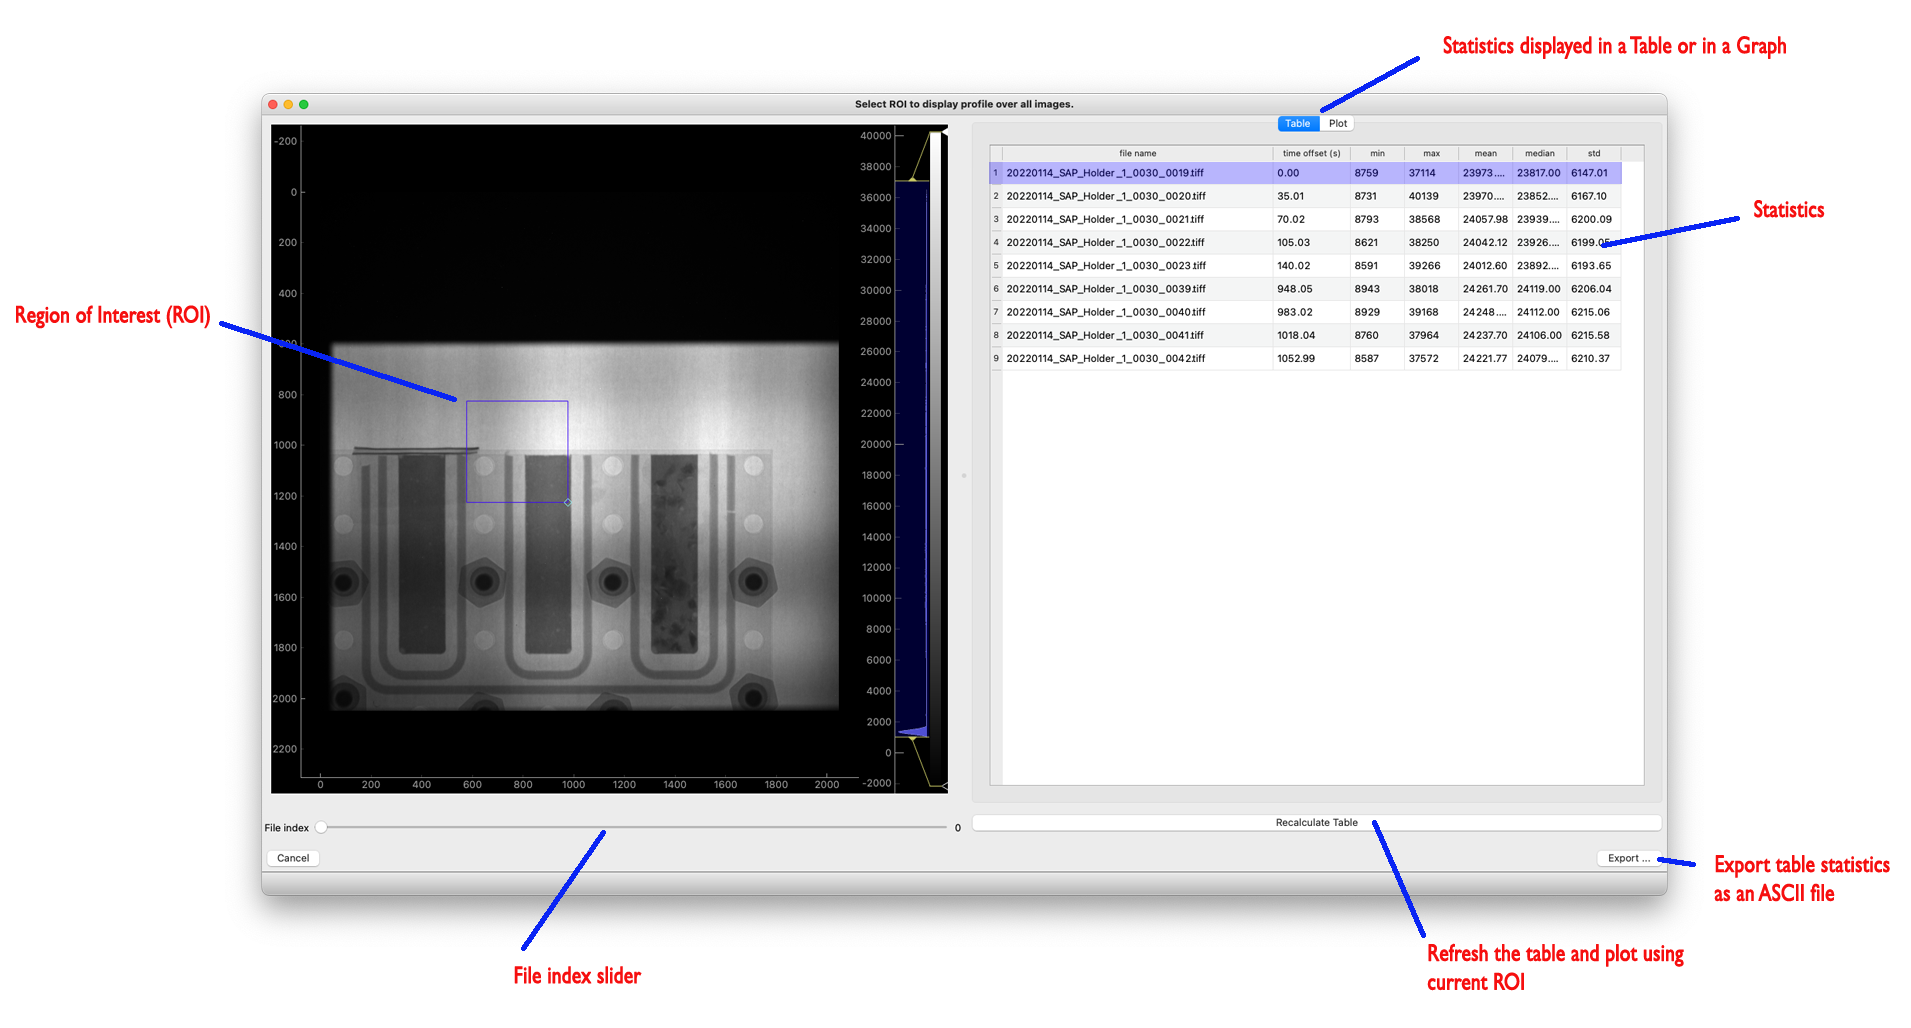
In order to move the region of interest (ROI), simply click and drag anywhere on the blue line of the ROI. To resize it, click and drag the bottom right corner of the ROI. Any changes to the ROI will reset the table content and the plots. Click the Recalculate Table button to update the table and plots.
Statistics
Table
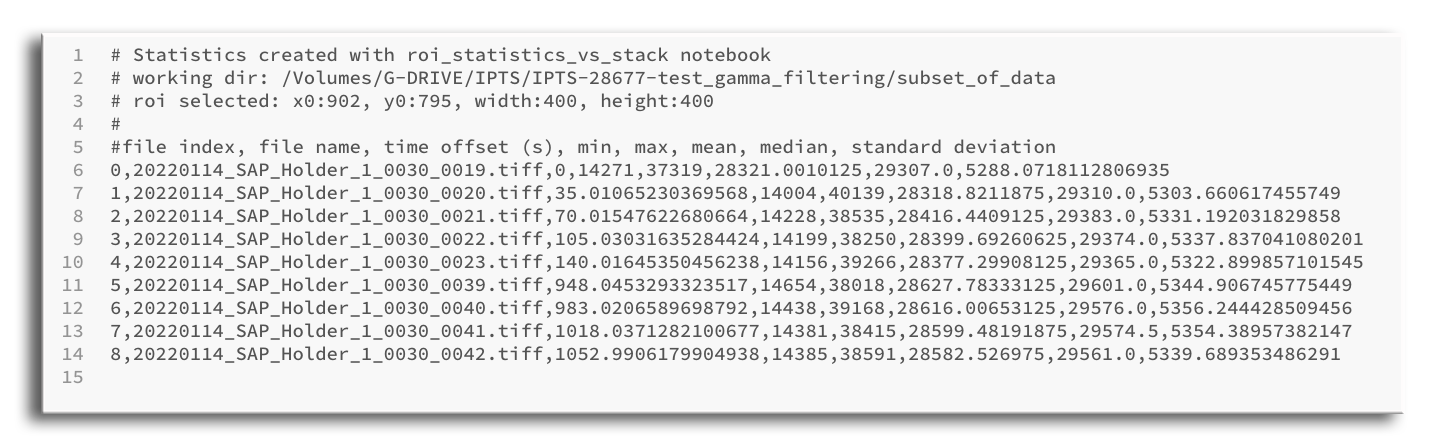
The statistics table has the following columns:
- file name: without the path
- time offset: relative to the first image, in seconds
- min: pixel counts within the ROI having the minimum counts
- max: pixel counts within the ROI having the maximum counts
- mean: mean of counts within the ROI
- median: median of counts within the ROI
- std: standard deviation of counts within the ROI
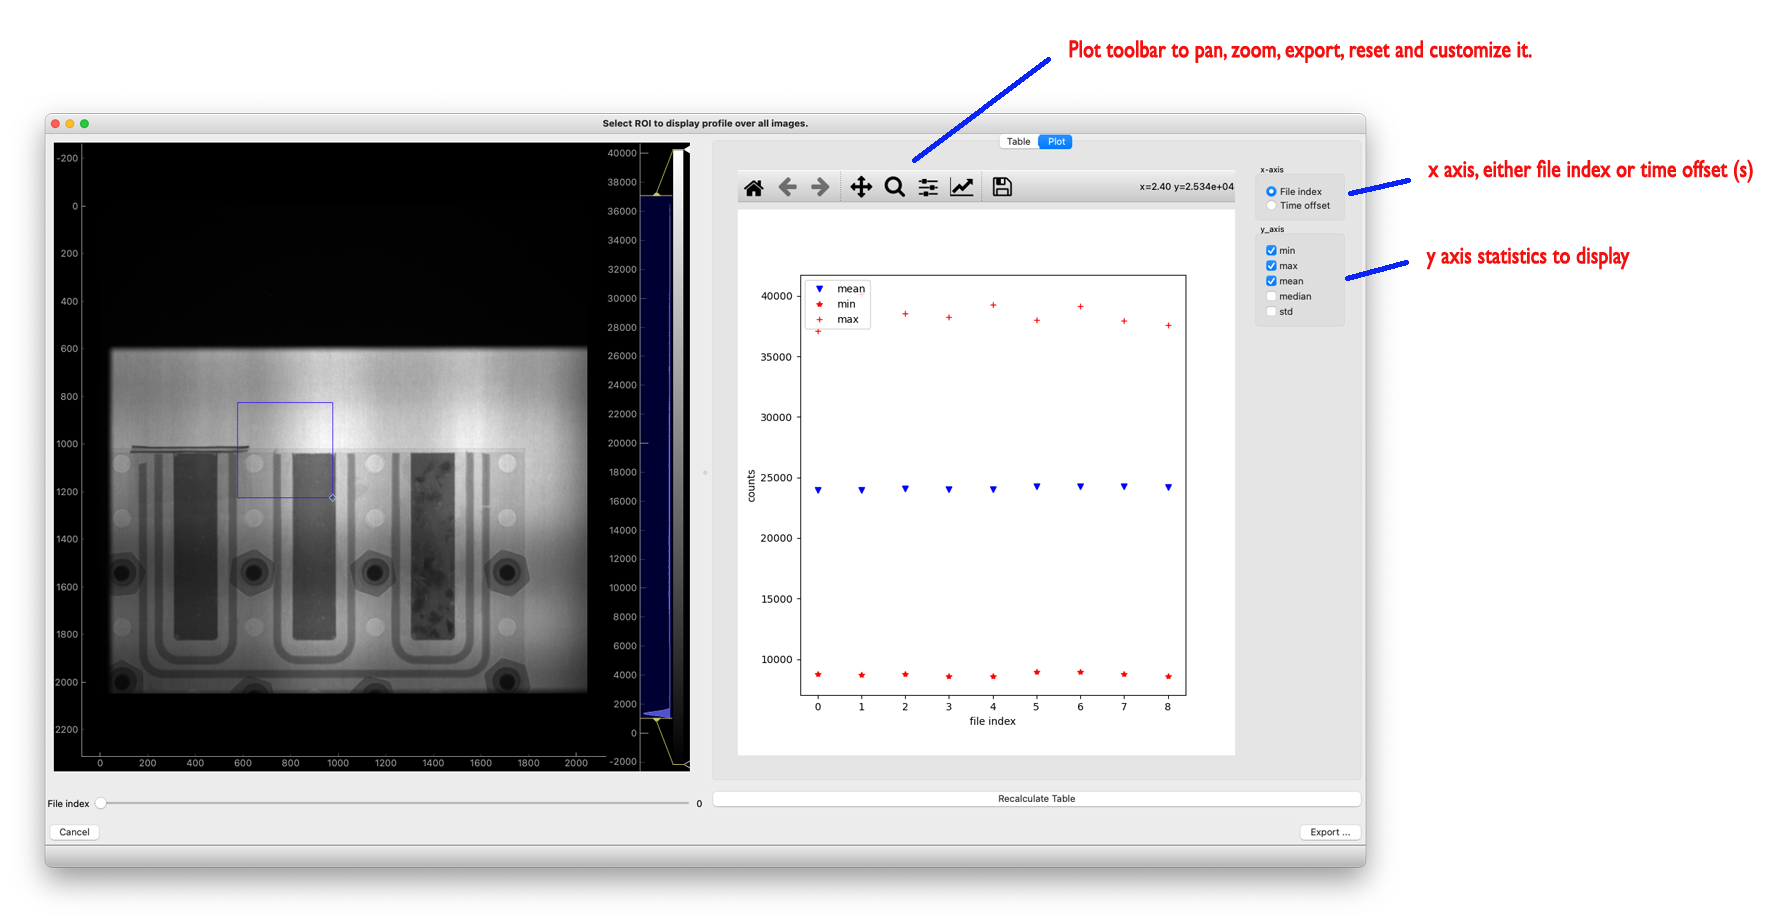
Plot
You can select the x-axis to choose
- file index
- time offset (s)
and any y-axis
- min
- max
- mean
- median
- std
File index
Any selection of a row in the table, or moving the file index slider will update the main plot and display the currently selected image.
Export
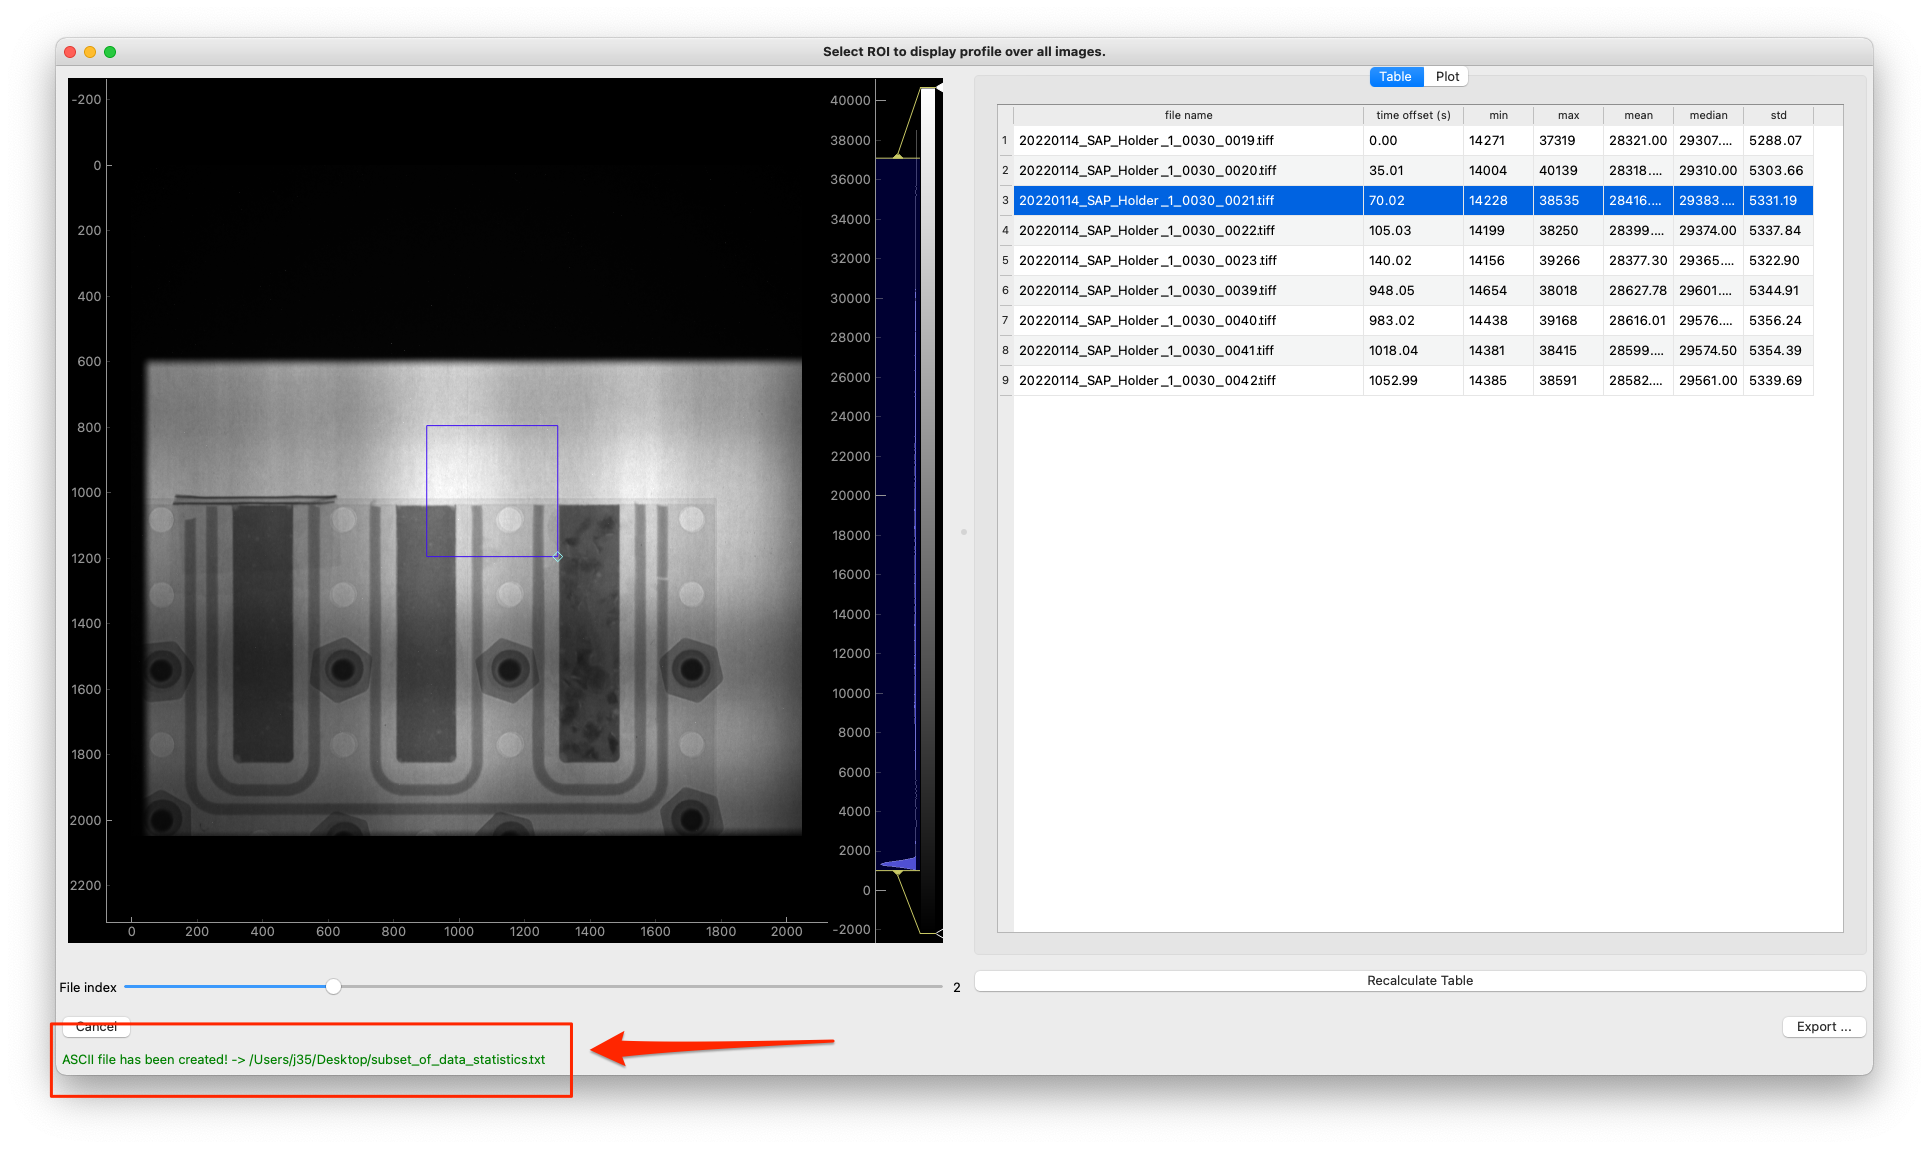
Click the Export … button to create an ASCII (CSV, comma-separated format) file in the folder location you specify.
If the Export … button is disabled, click first Recalculate Table.
The file name created will be based on the input folder + _statistics.txt
The bottom left status bar of the UI will let you know the location and full name of the file you just created.