maverick – GUI
Description
maverick is a pre-processing application that works with time-of-flight (TOF) data sets and has the following two capabilities
- combining data sets
- binning data sets
maverick allows you to quickly select the data sets to combine, choose how they will be combined, and then rebin the data using automatic, linear, or user-defined bins.
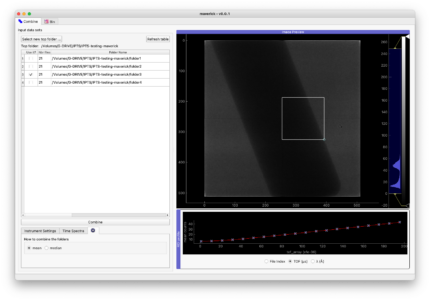
Screenshot showing the combine tab
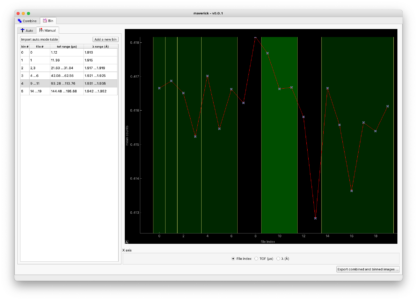
Screenshot showing the rebin tab
Tutorial
How to launch the application
- Connect to the analysis machine
- Open a terminal and type
![]()
> /SNS/users/j35/bin/start_maverick
Step by step
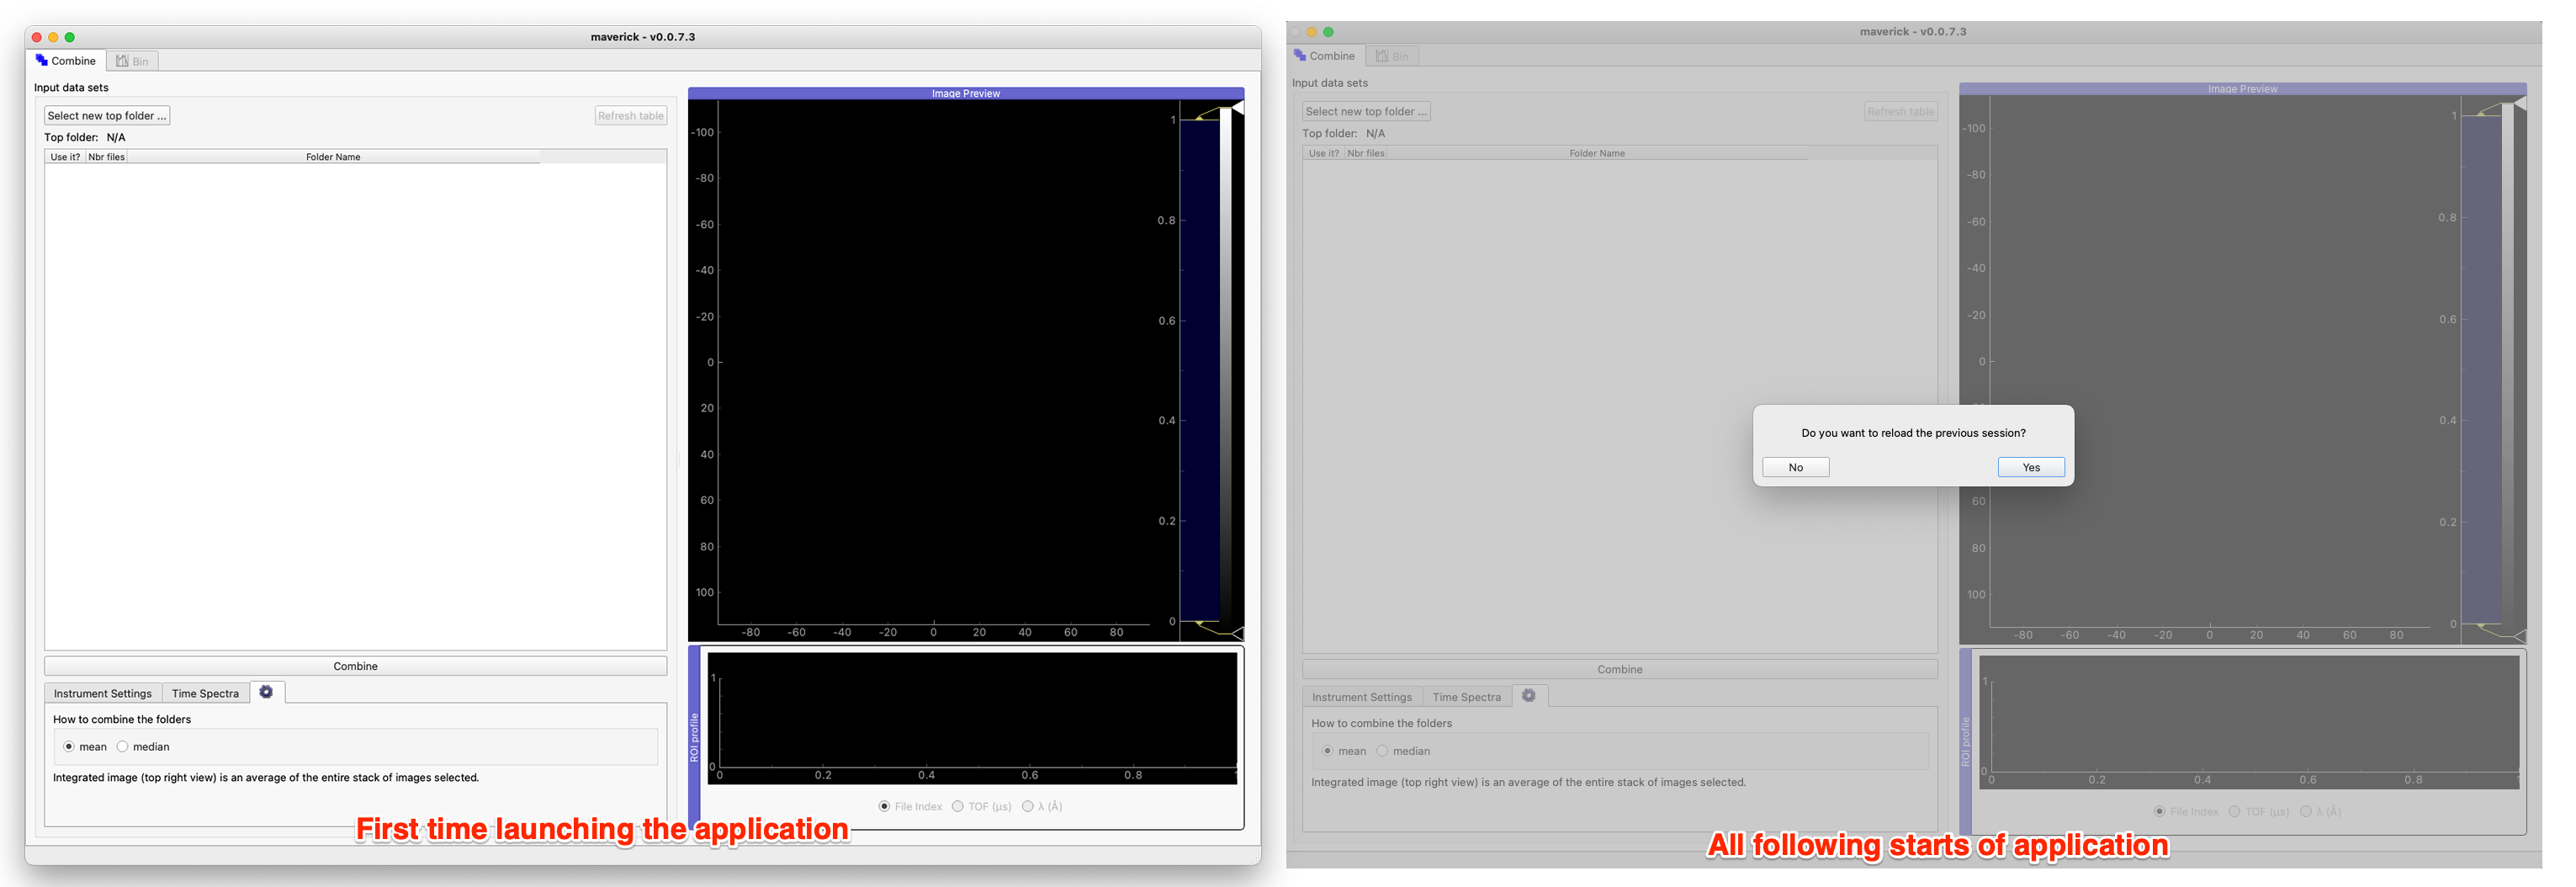
Once the application starts, you will directly see the user interface (UI) the first time you start it, or will have the option to load the previous session if you already used it.
Menu
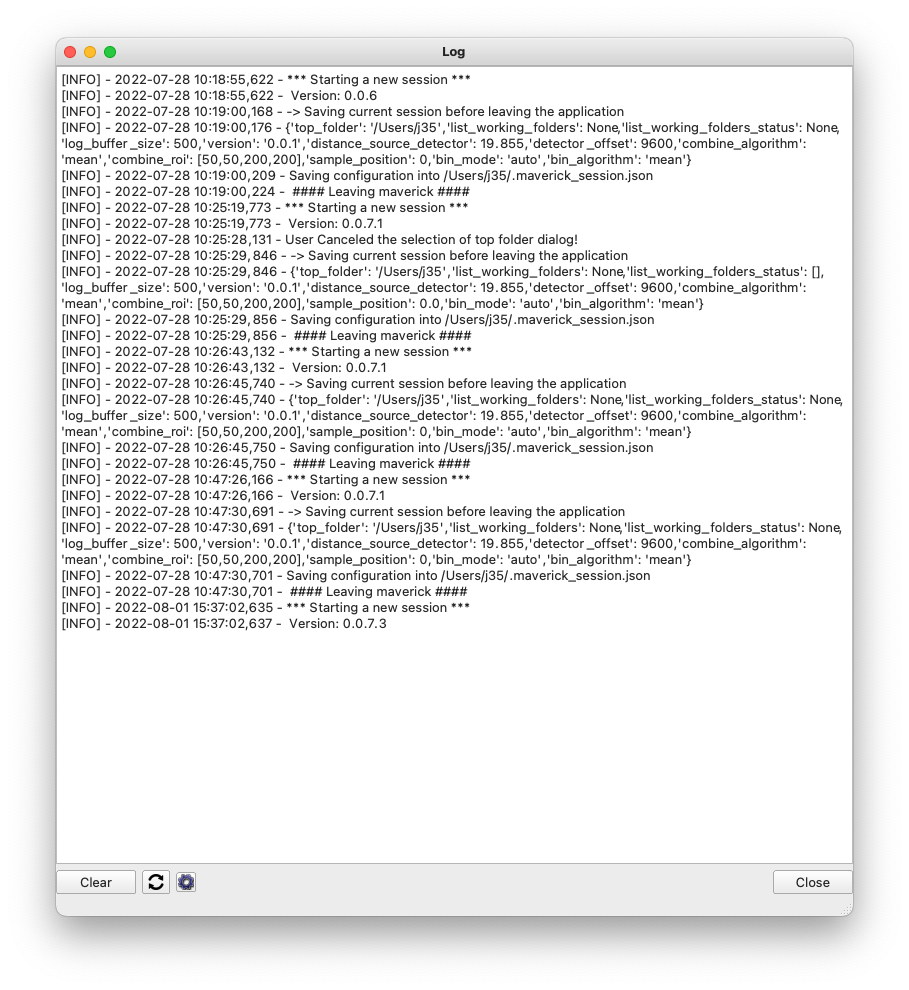
You can load or save a session using the top menu (Session menu). The help > log menu gives detailed information about what is going on in the program.
The two main tabs are
- combine
- bin
Combine
This is where you can combine several sets of data.
Select new top folder
Select the top folder where all the data sets are saved.
Remember to select the auto-corrected data, not the raw! Those will be found in the IPTS-XXX/shared/autoreduce folder.
Once the top folder has been selected, all the data sets (folders) will be displayed.
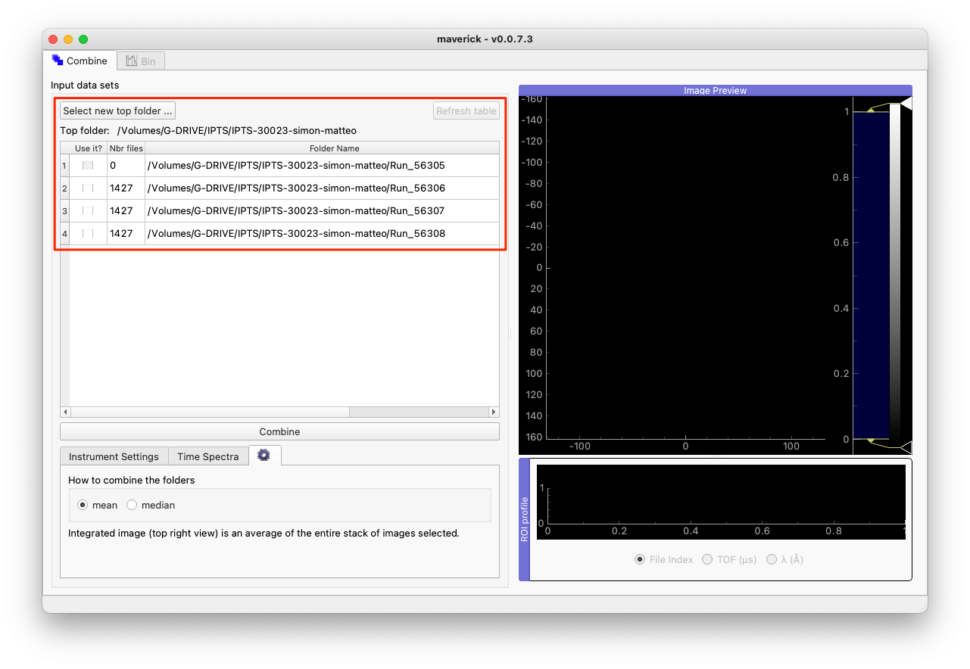
The left table gives, for each folder, the number of files in it and the full path to the folder. If a folder is empty, the use it switches is automatically disabled.
Click the use it for the folders you want to combine. Clicking a new row that hasn’t been loaded yet will display a progress bar (bottom right) showing that the data are currently being loaded into memory.
Only folders (data sets) with the same number of files in them can be combined.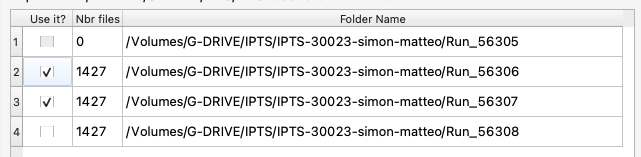
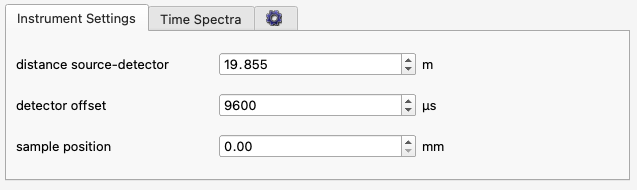
Instrument settings
This is where you define the instrument settings, such as distance source-detector, detector offset, and sample position. The first two will be used in the conversion time-of-flight (TOF) -> Lambda. The sample position is used when naming the exported data.
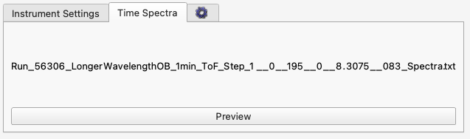
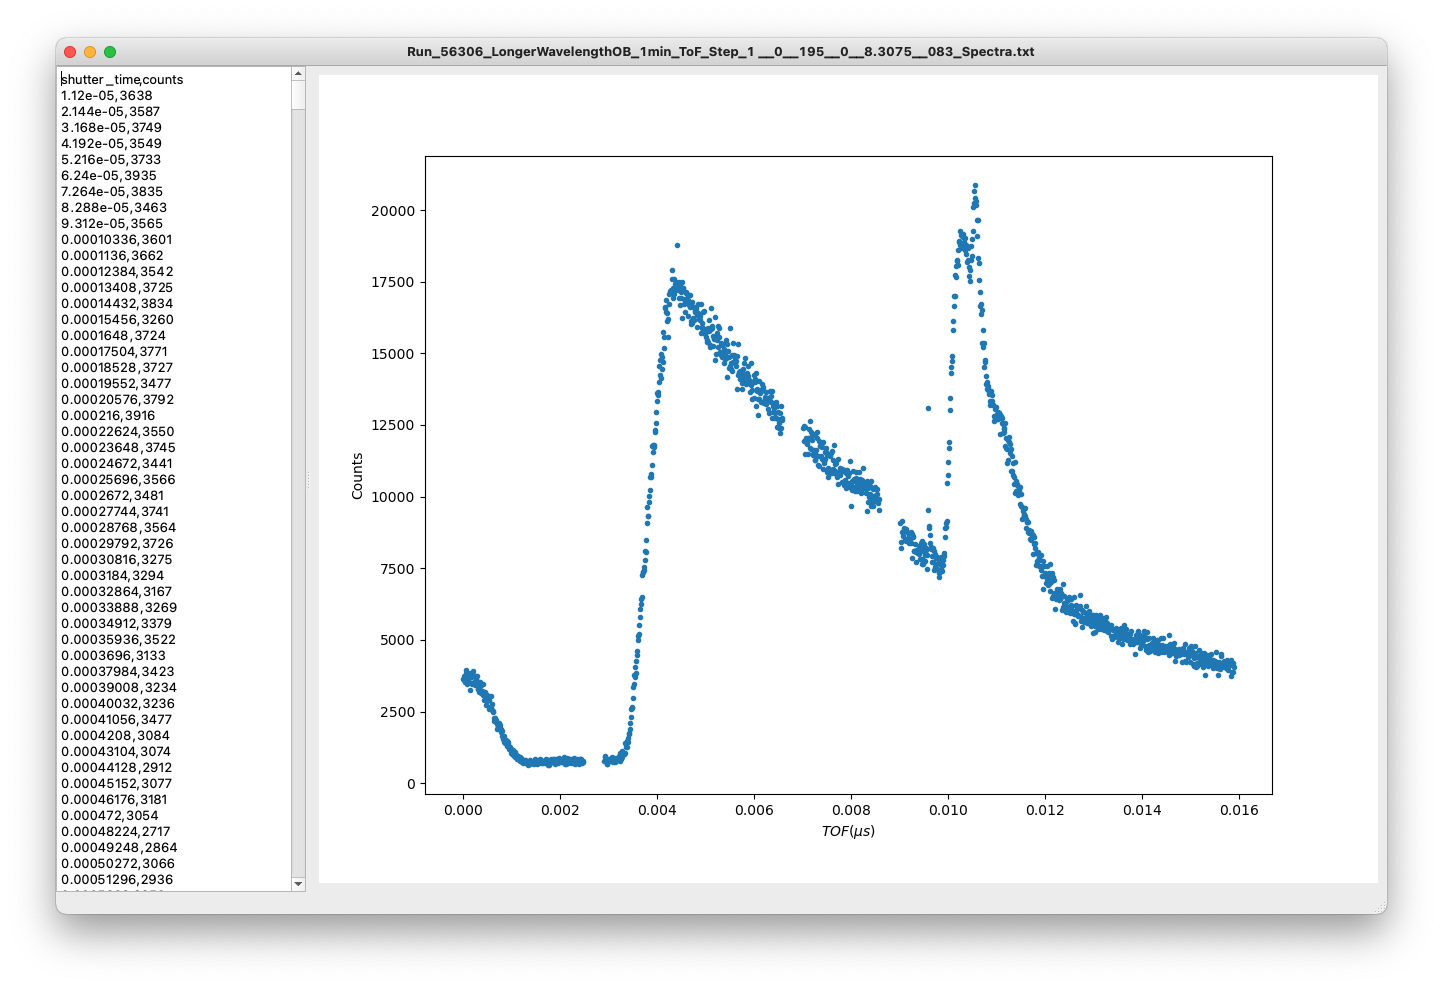
Time spectra
The data sets you are working on should have a time spectra file (…_Spectra.txt). The spectra file of the first data set selected will be loaded and used to convert TOF into lambda. You can get a preview of the time spectra file by clicking preview.
Combine settings
This is where you can specify how the data will be combined.
Display
The right plot allows you to check the profile (bottom plot) of the ROI selected (top view). Feel free to change the x-axis of the profile (file index, TOF, or lambda).
If you select Lambda, changing the distance source-detector and/or detector offset will modify the x-axis.
The right view can be resized and moved around as demonstrated here.
If new files show up inside the top folder, click refresh to update the list of files.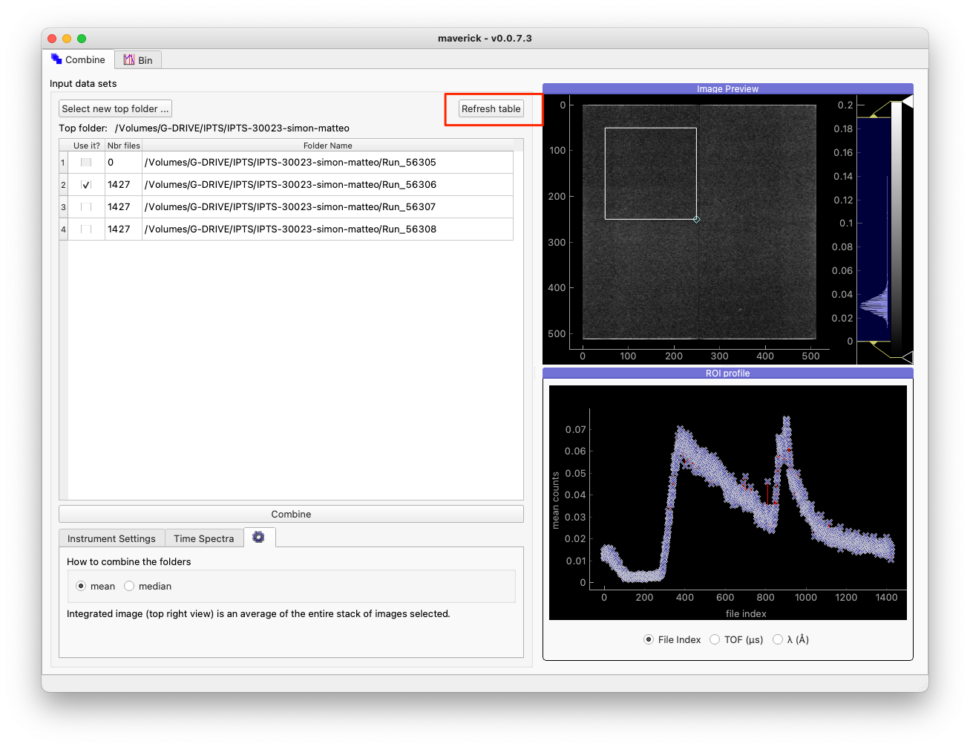 If you want to export the combined files, click combine
Bin
This tab allows you to chop/bin the images using a logarithmic, linear, or used-defined bin algorithm.
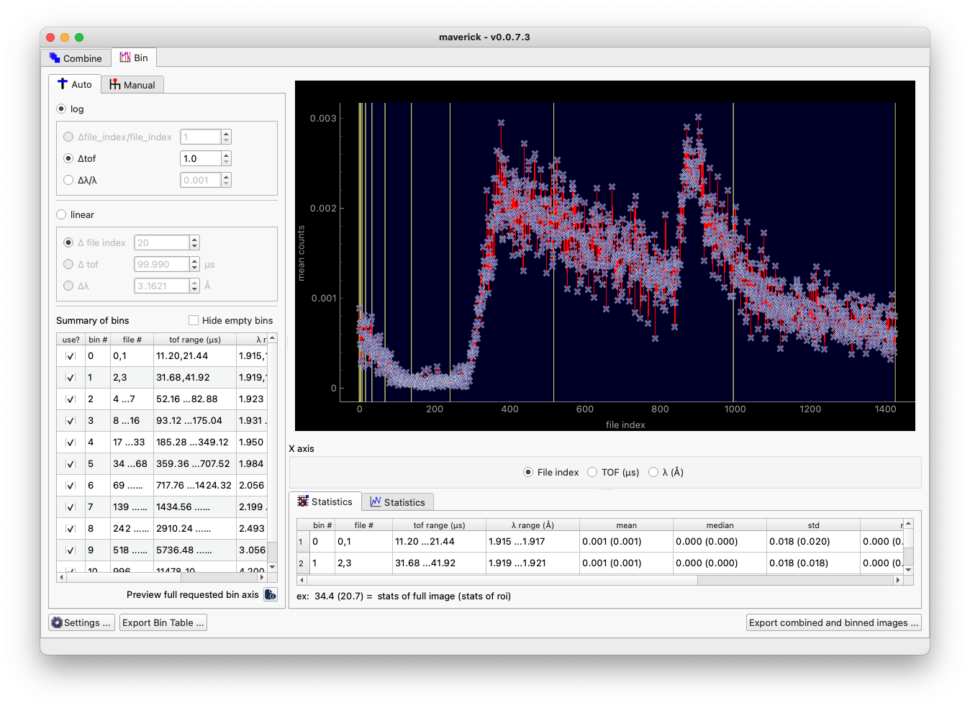
Automatic mode
logarithmic
Logarithmic binning of the TOF or lambda is available. Validate first the units to use (TOF, lambda) to enable the combo box, set the new value, and hit ENTER. Every change will update the right plot, displaying yellow lines at the edges of the bins.
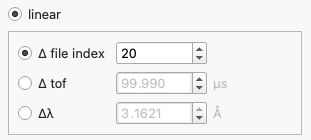
Linear
Just like for the logarithmic binning, linear binning works the same way with the only difference being that you can use the file index as a working-axis.
Summary of bins
The table, bottom left corner, displays the list of bins created with the following information
- option to validate that bin and use it, or in other terms, to export that bin into an image
- bin number
- range of that bin in file index
- range of that bin in TOF units
- range of that bin in lambda units
You can also automatically hide all the empty bins, bins with no files.
![]()
You can also get a complete list of the current axis selected (right plot) by clicking the Preview full requested bin axis button.
example
file #: 0…3 means that files 0 to 3 are part of that bin
file #: 0,1 means that files 0 and 1 are part of that bin
Manual mode
The first thing you will see in the manual mode is the Import auto. mode table button. This button will import all the bins from the automatic mode table.
In this mode, every single bin can be manually moved by dragging the edge bin marker on the plot. The new file-index, TOF and lambda ranges will be updated in the table.
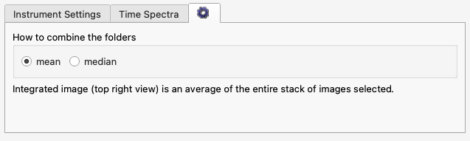
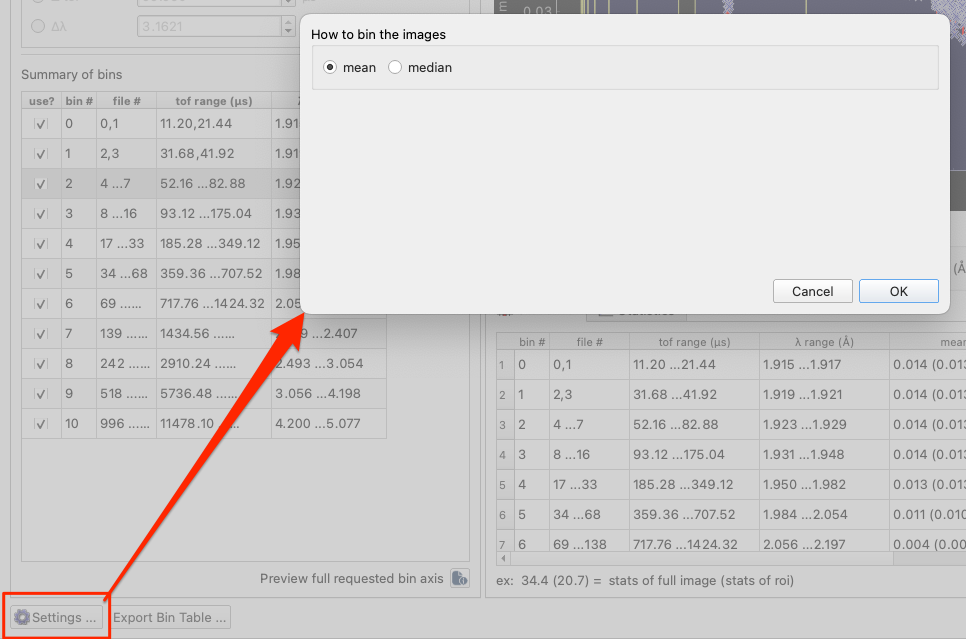
Settings
the bottom left button allows you to define how the images will be grouped, using either mean or median algorithms.
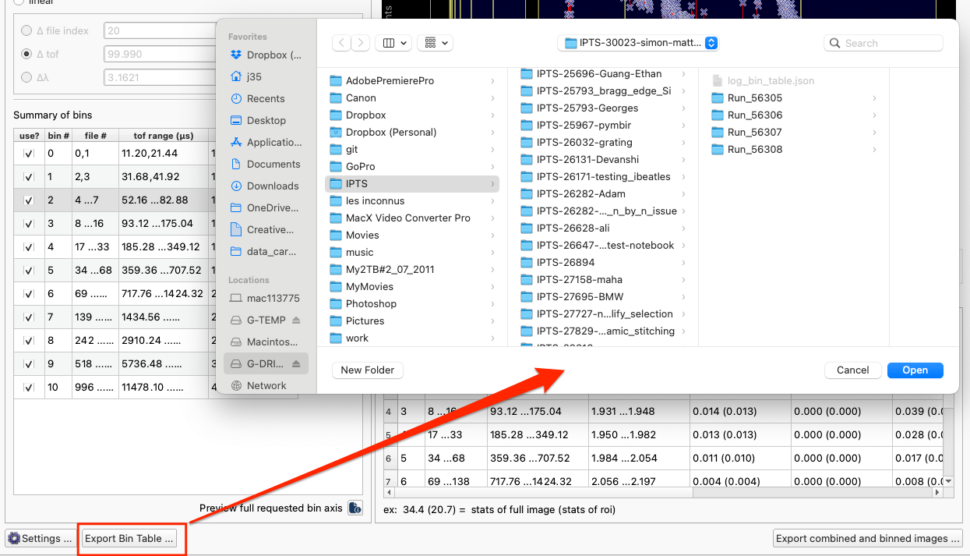
Export bin table …
Use this button to export the current table into a JSON file. You will be able to reload that table in the manual tab.
Statistics
The bottom right part of the bin interface displays a couple of tabs with statistics of the bins in a table and a graph.
Export combined and binned images …
This is finally where you need to click to export the bin images. Just select a final location and the images will be created.
