Bragg edge normalization
Description
This notebook is dedicated to the normalization of data set taken at the SNS.
Tutorial
Select your IPTS
Need help using the IPTS selector?
Select a raw data input folder
Using the folder selection tool, select the sample folder. If the time spectra file is part of the folder, it will be automatically loaded, if not, you will have the option to manually select the time spectra file next, or just ignore it and click the button dot not select any time spectra
If you select a time spectra file, it will be automatically copied into the output folder. this will facilitate the next step which is usually the extraction of the Bragg edges versus lambda/TOF into an ASCII file.
The sample data will be automatically loaded and a message will inform you of the number of files loaded and the status of the time spectra file.
Select mode of normalization
You will have now the option to perform the normalization using two modes:
- using open beam
- using the background region of sample
With open beam
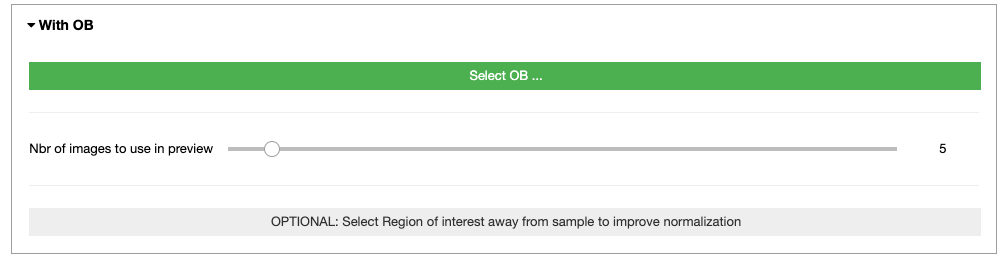
- Select first the OB folder by clicking Select OB …
- The slider defines the number of images to use in the preview to select the ROI. The higher the number of images, the better the contrast, but the slower the loading.
- OPTIONAL: Select a region of interest (ROI) (ROI selection tool tutorial here)
Select a region away from the sample
Without open beam
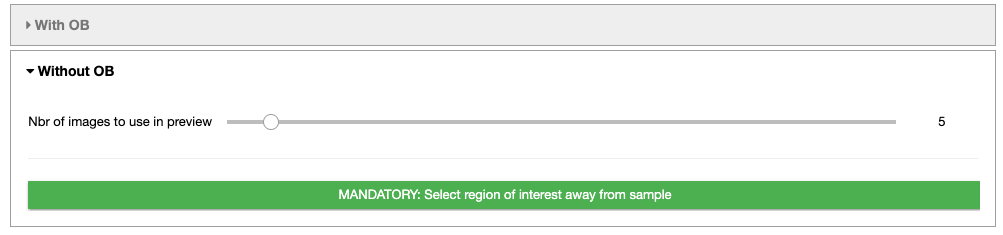
- The slider defines the number of images to use in the preview to select the ROI. The higher the number of images, the better the contrast, but the slower the loading.
- MANDATORY: Select a region of interest (ROI) (ROI selection tool tutorial here)
Select a region away from the sample
Export normalized data and time spectra file
After running this cell, you will be asked to select the output folder to use to create the normalized images.