Outliers filtering tool
Description
This notebook allows you to compare data loaded without any correction against data loaded with outliers removed. Outliers’ pixels are:
- dead pixels (pixels with 0 counts)
- gamma counts (pixels with very high counts compare to neighbor pixels)
If any of the dead pixels and/or gamma counts options is turned on, a bad pixel is replaced by the median value of the surrounding pixels. This surrounding region can be defined by the user and is by default a square of
3 by 3 pixels around the pixel of interest.
Tutorial
Select your IPTS
Need help using the IPTS selector?
Select Images
Use the file selection tool, to select the images.
Launch the user interface (UI)
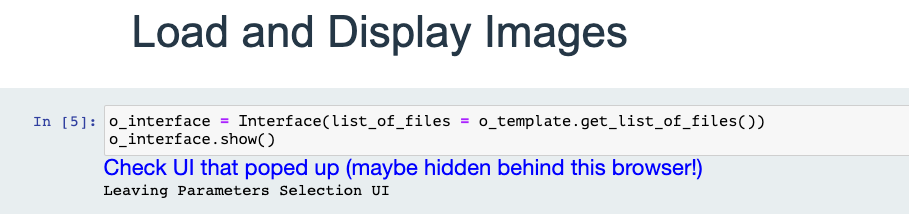
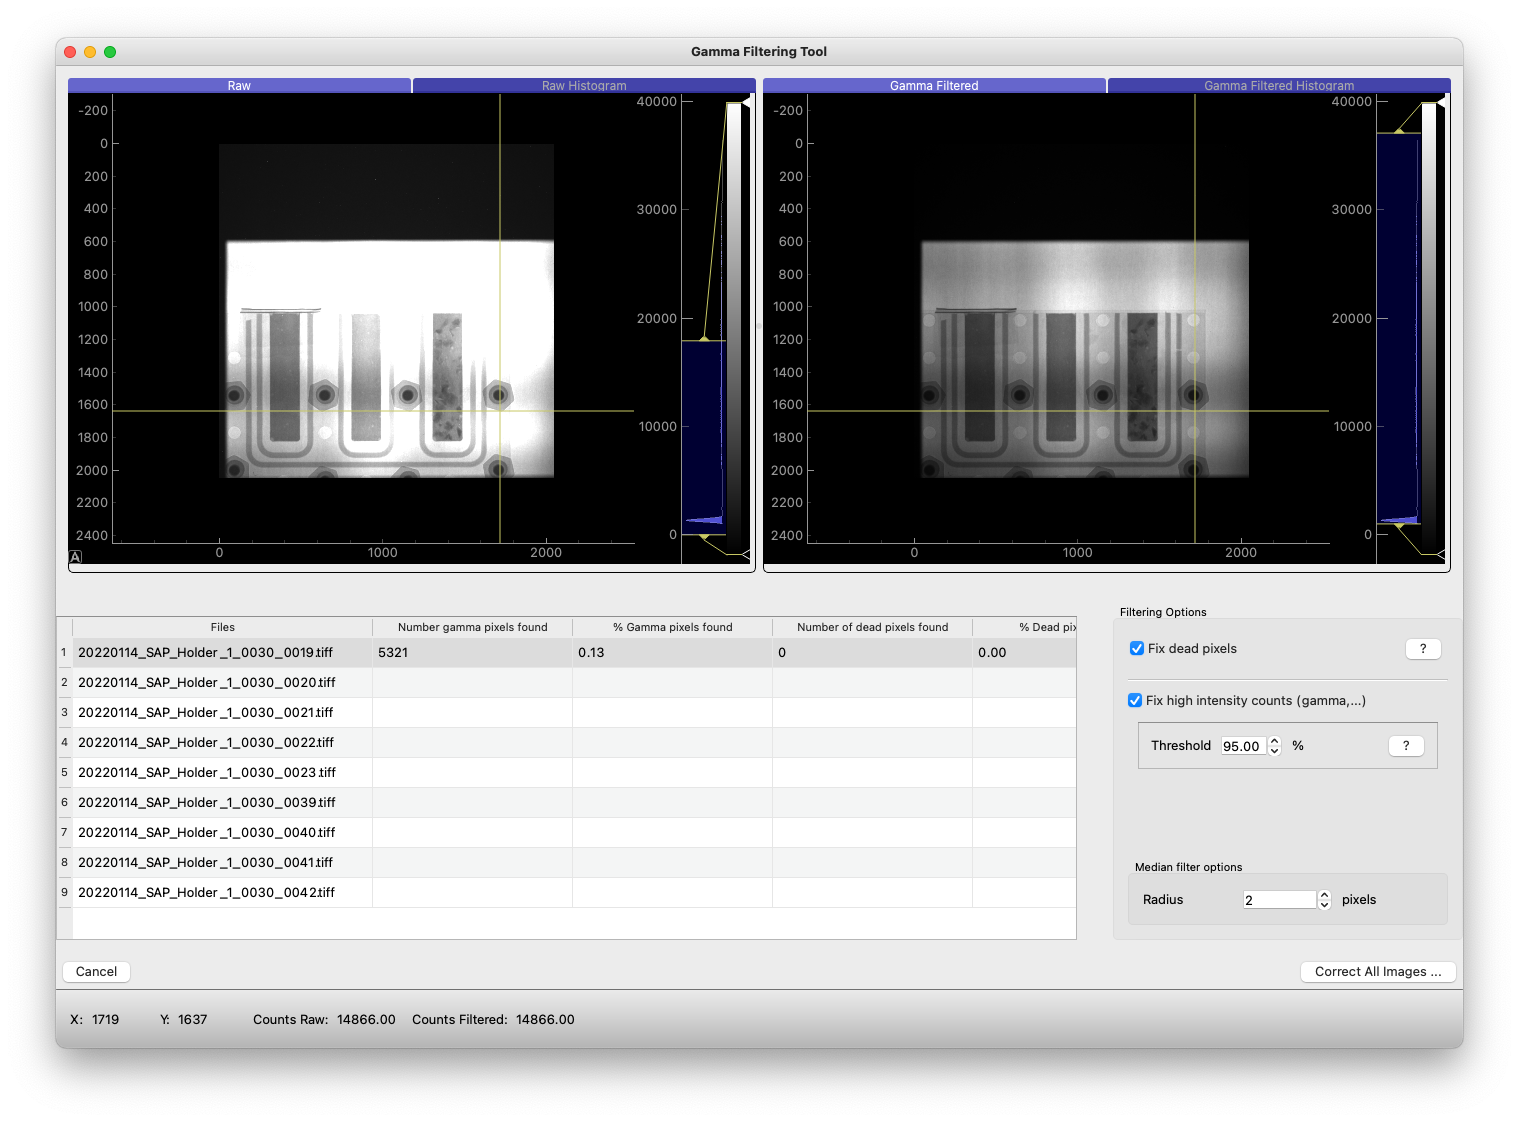
Display images
In some cases, the first image you see of your sample is zoomed out too much. Click the Autoscale to reset the display.
Mouse Infos / Zoom and Pan
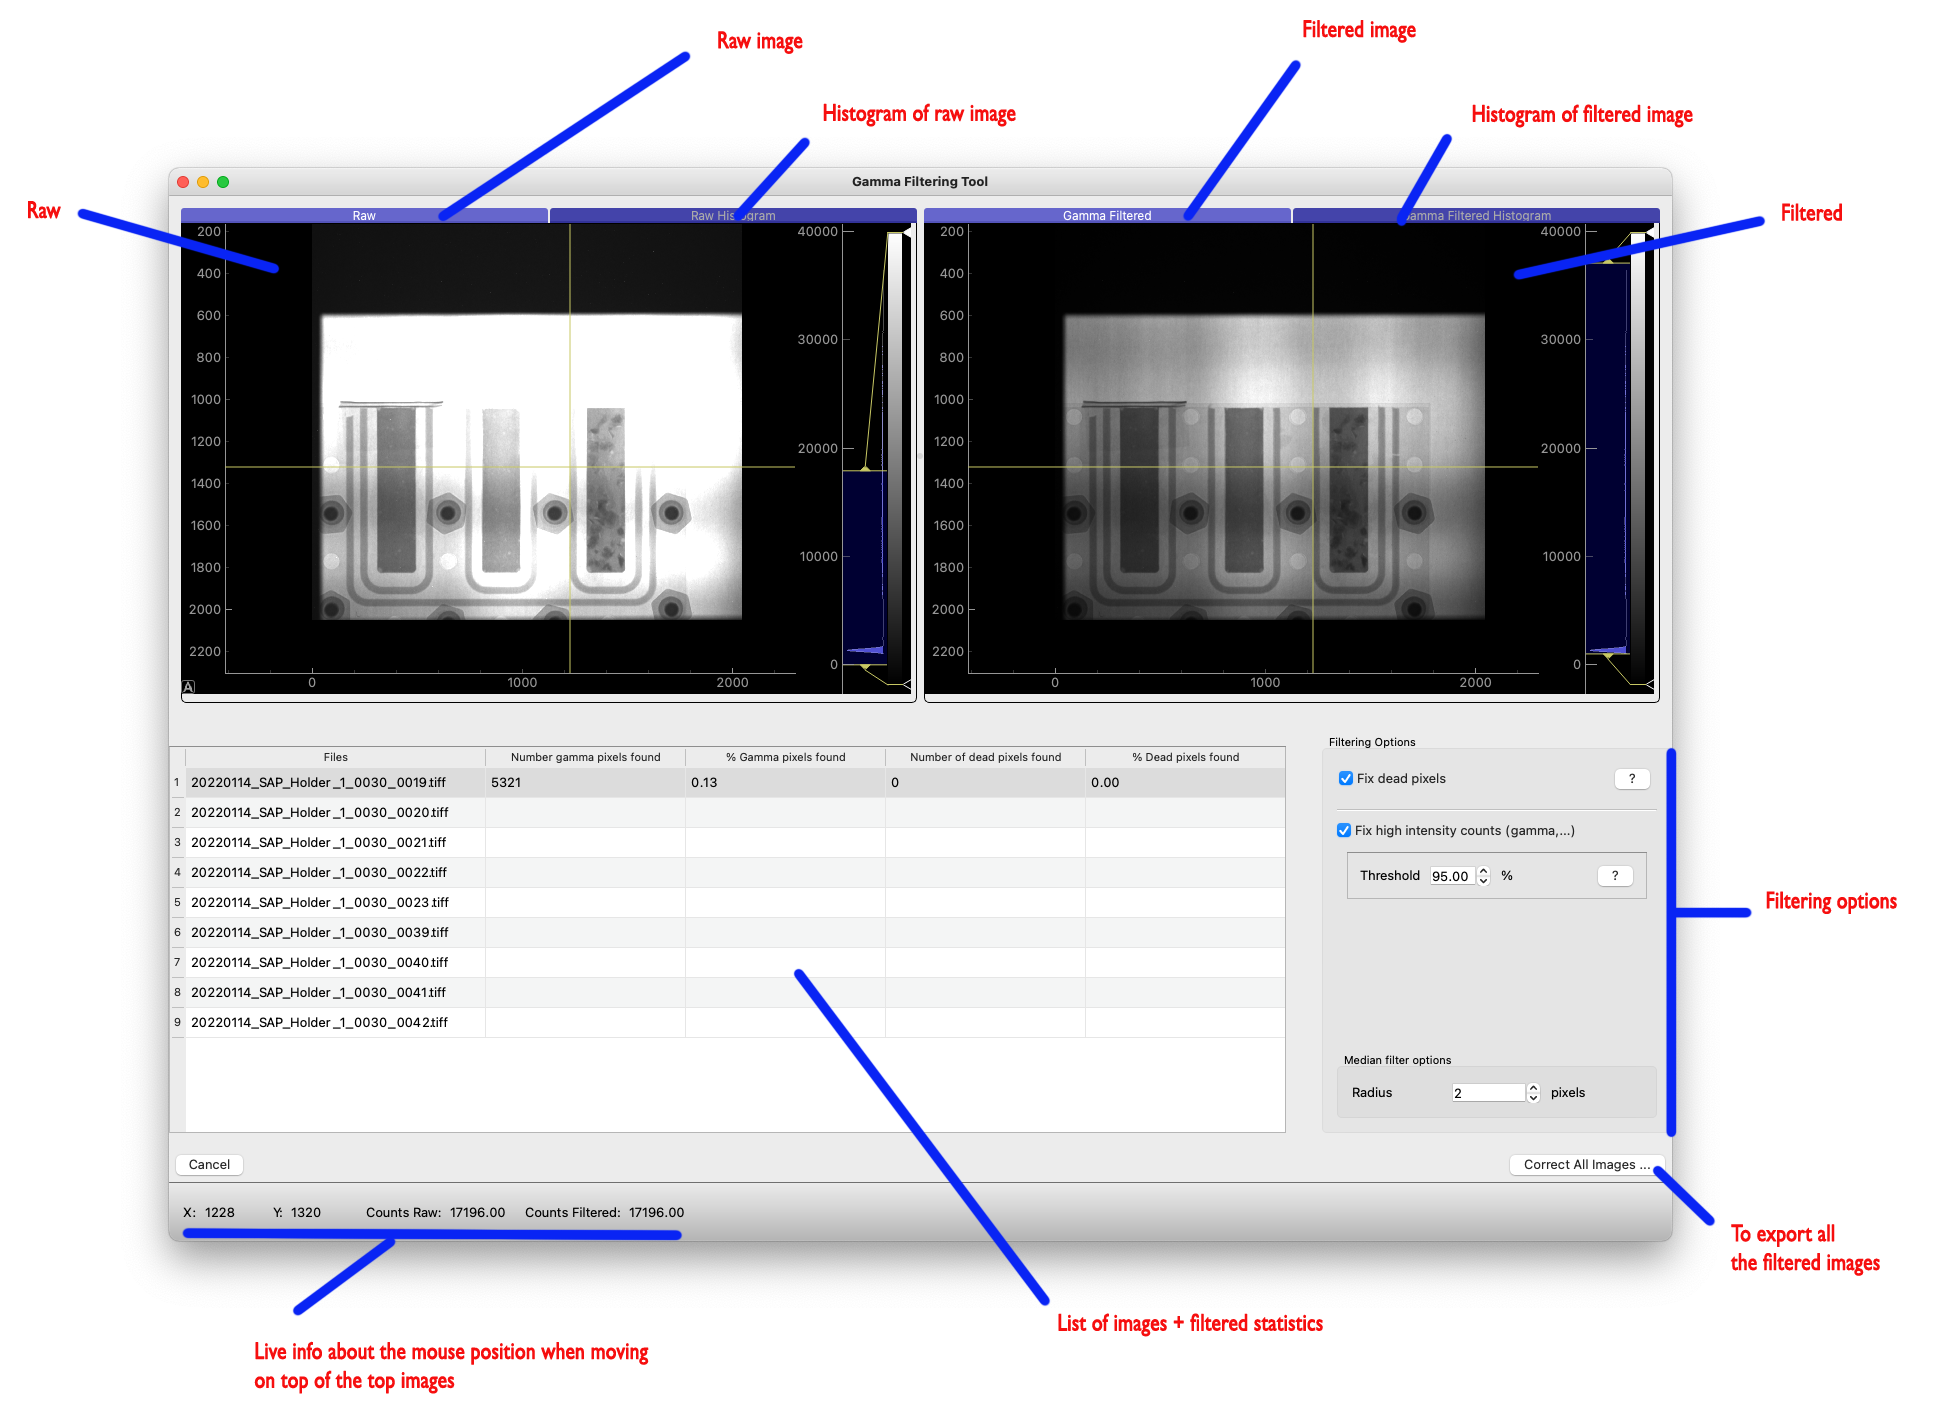
Moving the mouse over the raw or filtered image will give you its value in the status bar (bottom left) of the UI. Also, any zoom or pan transformation in one of the images will be reproduced in the other image.
Filtering Options
Dead Pixels
When turned on, all pixels with 0 counts will be replaced by the median value of the block surrounding that pixel. The block width and height are defined by the radius widget at the bottom right of the interface (Median filter options)
High-Intensity Counts
A pixel is considered to have a “high-intensity count” if the following formula is true
counts_of_pixel_in_raw_image * coefficient > counts_of_pixels_in_median_image
where the coefficient is a value between 0 and 1.
Median Filter Options
This defines the region surrounding the pixel to calculate the median value.
ex: if the pixel have the following values [1, 1, 2, 3, 4, 4, 5, 6], the median is 3.5 ((3+4)/2) ex: [1,2,3,4,5,5,6,6,8], median is 5.
Feel free to move the plot around and resize them!
Histogram of Raw and Filtered Data Sets
You can visualize the histogram before and after filtering by clicking the Histogram view.
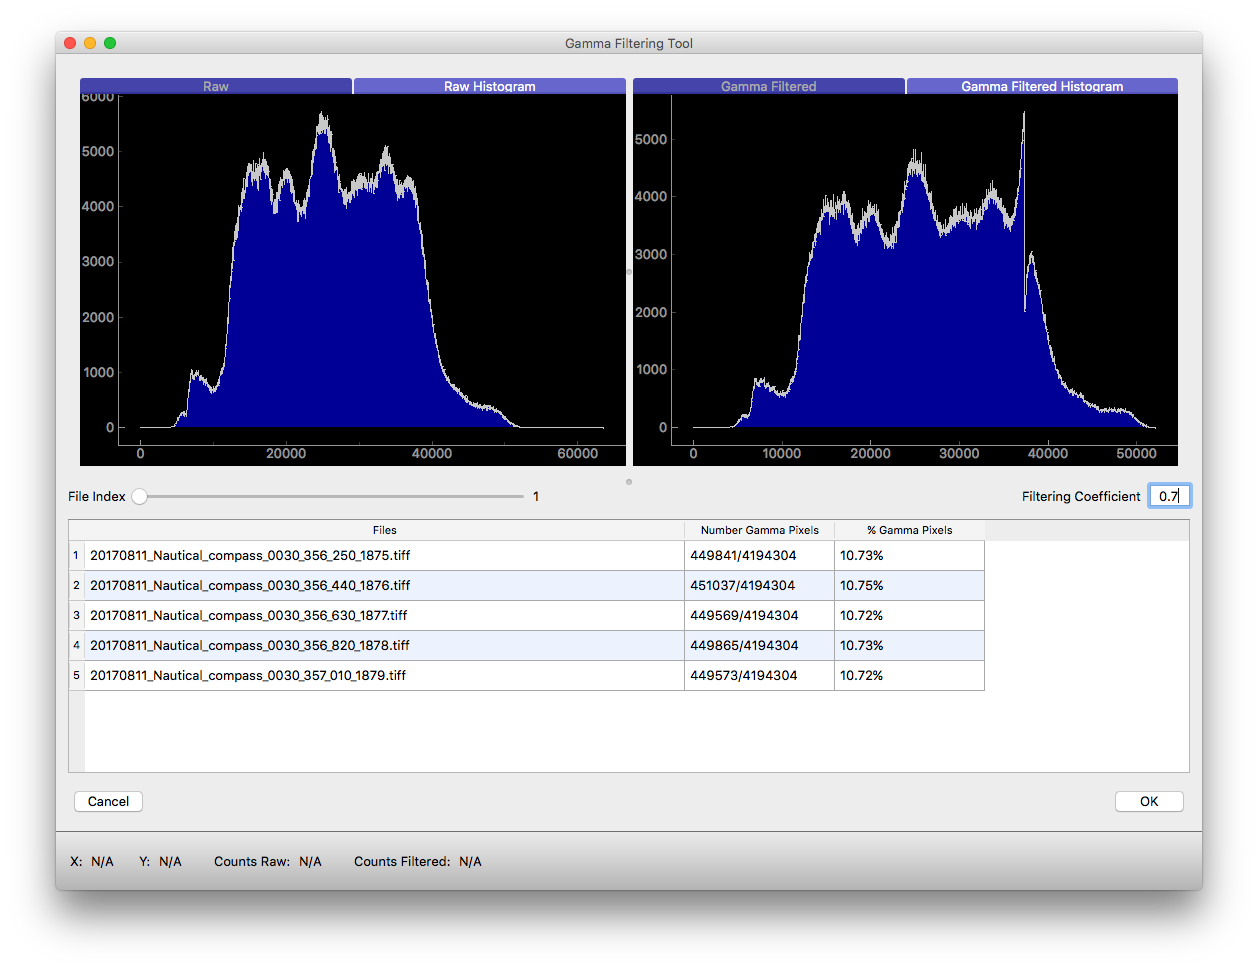
Table
Only the data of interest are loaded when requested. If one clicks a row, the data of this raw are loaded and go through the filtering process. Statistics about the pixels cleaned is then displayed in the table
Export
Click the Correct All Images… button (bottom right) to correct all the data and create a new folder based on the input folder name + _outlisers_corrected.
If the output folder already exists, the current date and time will be prefixed to the folder name to make sure the previous folder is not replaced!
