Bragg edge profile
Description
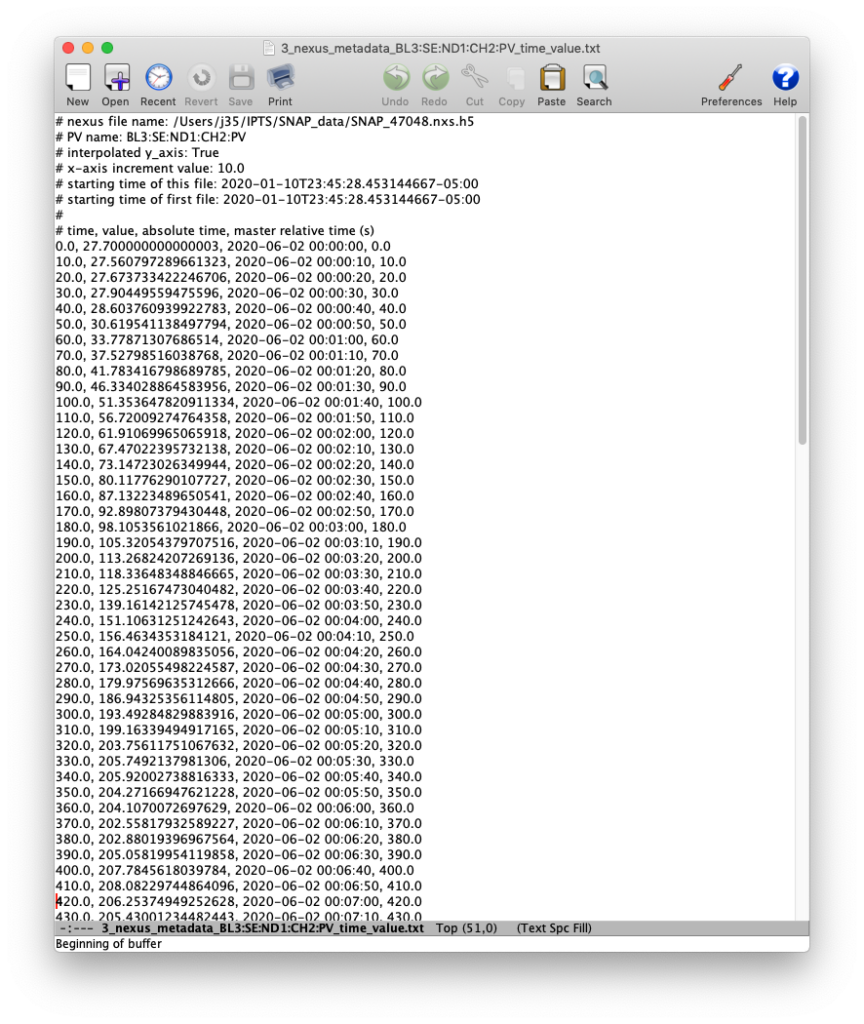
This notebook has been implemented to produce an ASCII file of the average counts of the entire image, or, of selected regions, versus lambda (Angstroms) and TOF (microS).
The output ASCII file looks like this
Start the notebook
If you need to access the notebook, check the following tutorial on how to start the python notebooks.
Select the IPTS
TIP: Need help using the IPTS selector?
Select data folder
TIP: Need help using the file selection tool?
Select the folder containing the data to play with. If the time spectra file is part of the folder, it will be automatically selected, if not, you will have the option to manually select the file.