Registration
Description
This notebook will allow the registration (alignment) of a set of images using a reference image of your choice.
4 different modes of registration are offered
- Automatic mode (let the program try to align your data for you)
- Manual mode (you have full control of how to move each of the images manually)
- Marker mode (define markers on the images and align them)
- Profile mode (use high contrast feature to align horizontally and vertically images)
See the respective tutorial to learn more about each mode.
Tutorial
Select your IPTS
Need help using the IPTS selector?
Select images to process
Using the file selection tool, select the images your want to process. Once you click the Select button, the time stamp and the images will be automatically loaded. Wait for the progress bar to be done.
UI presentation
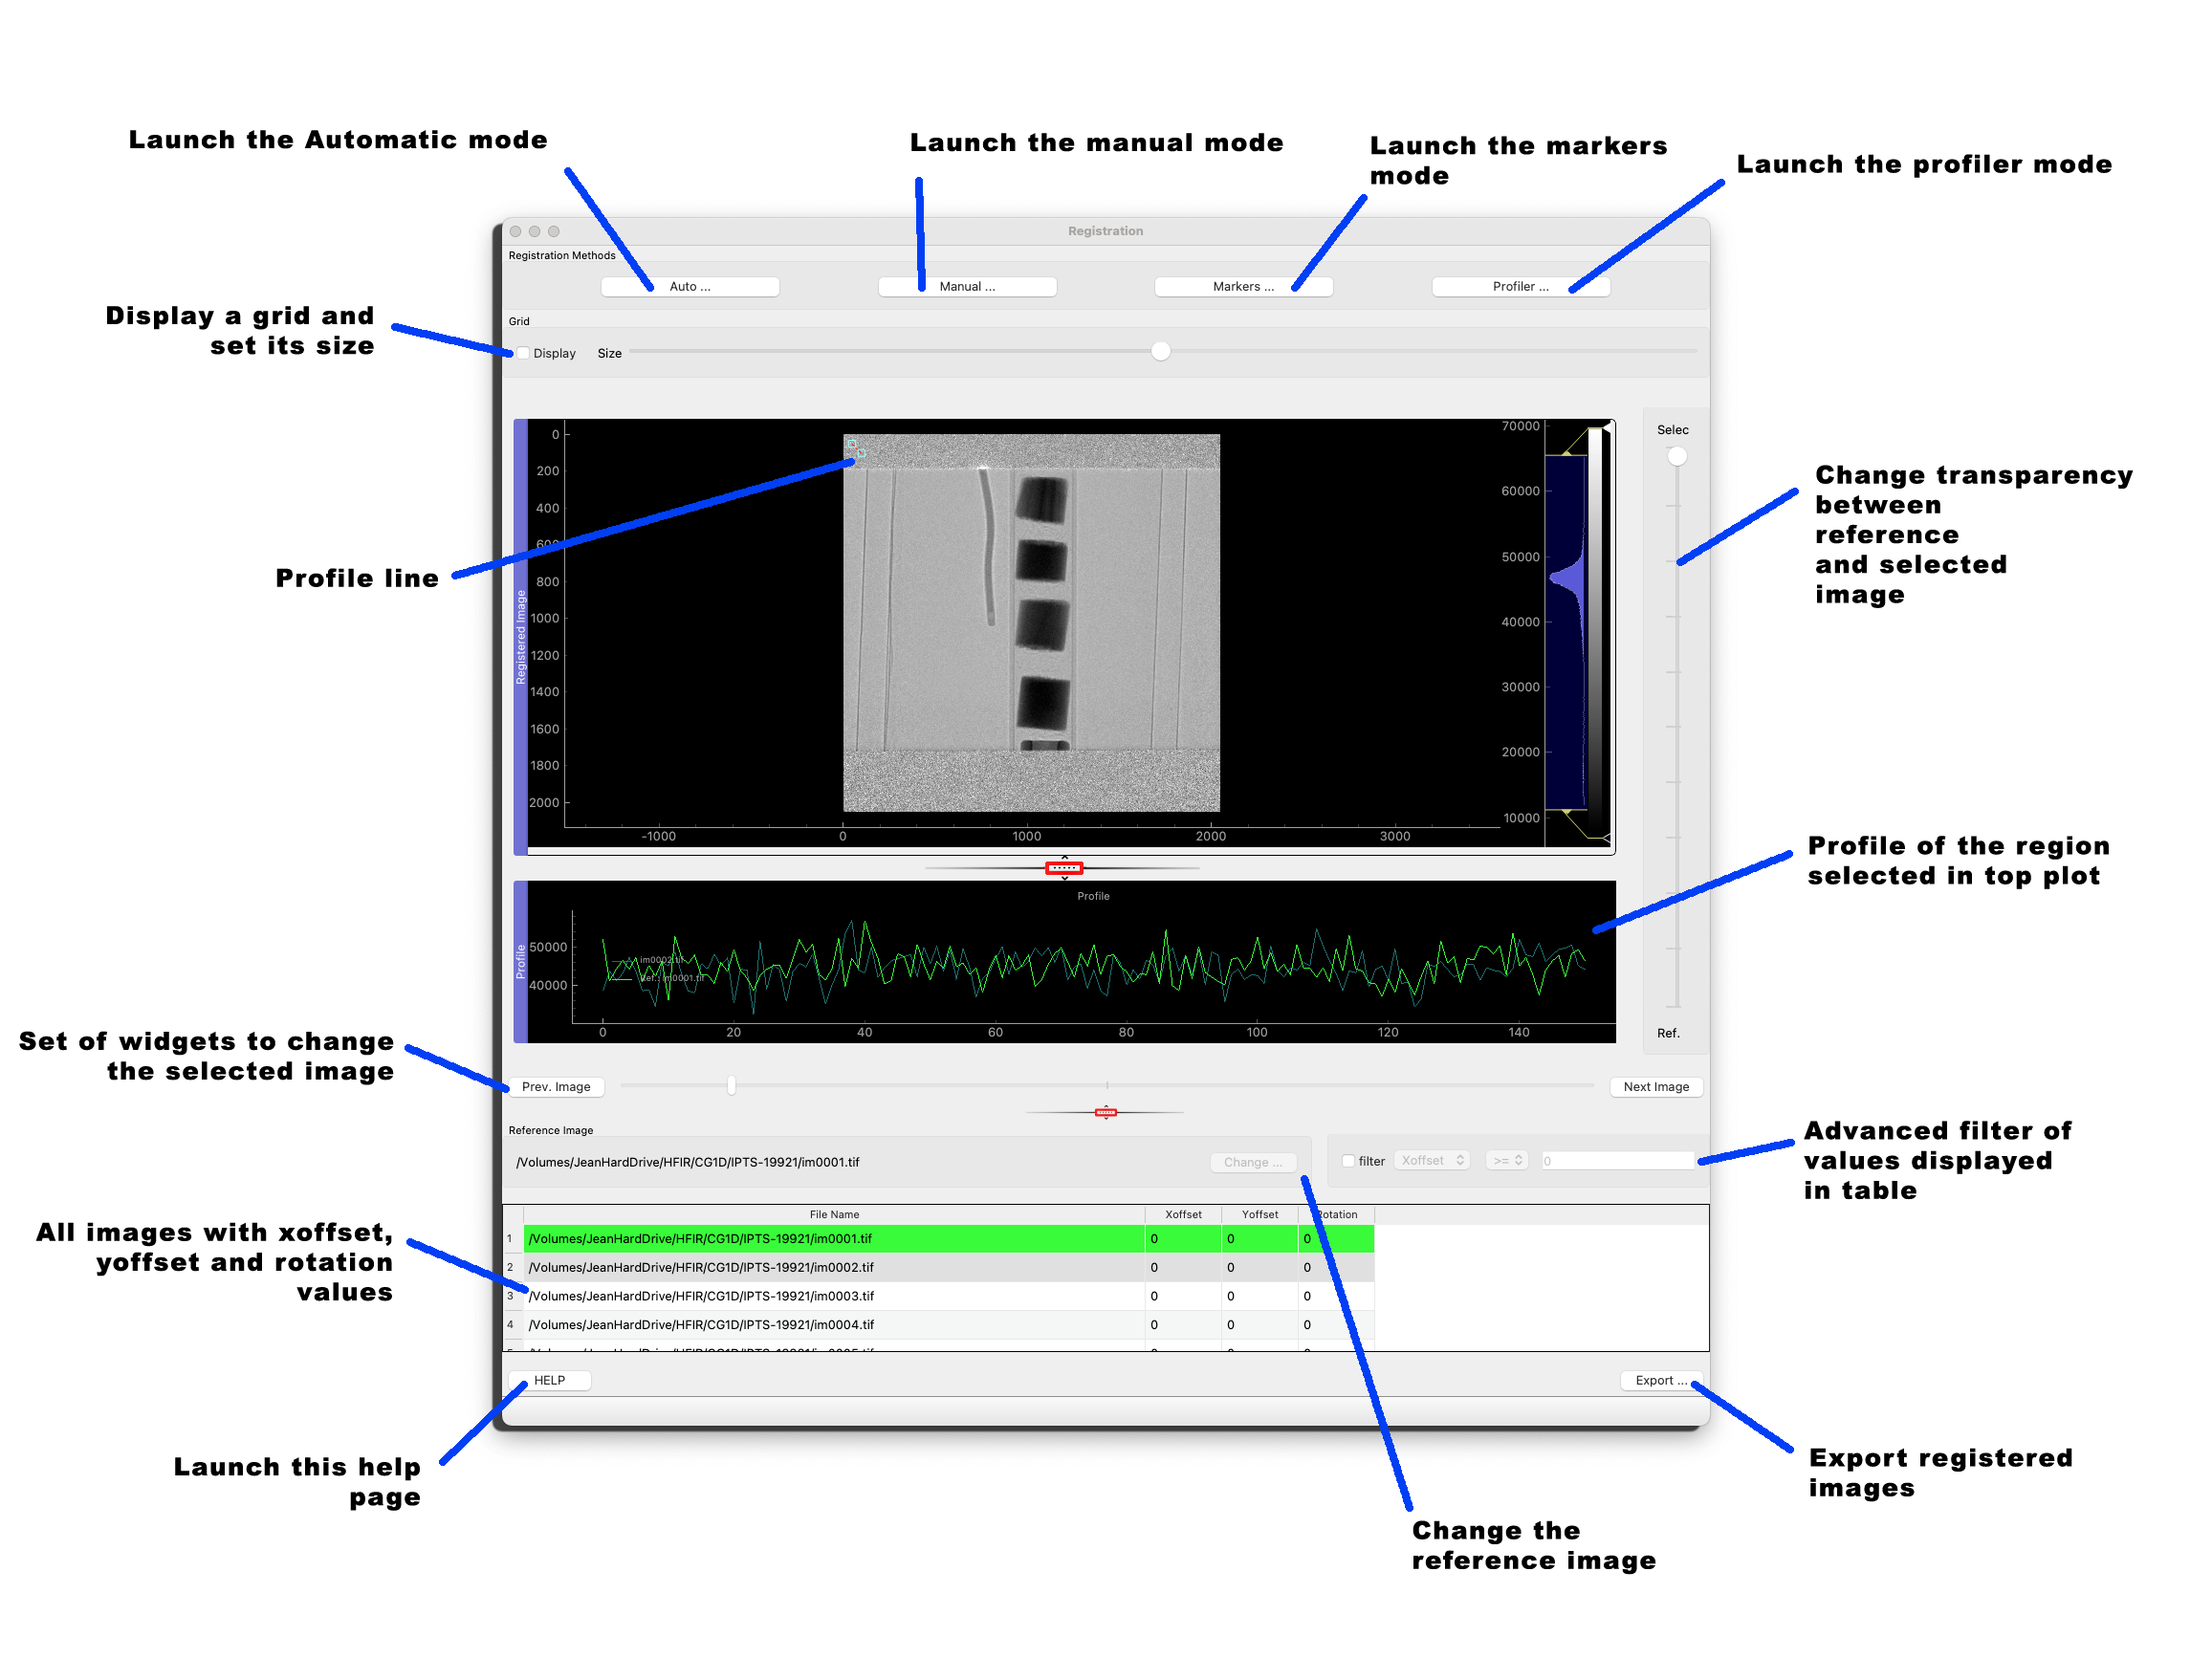
Registration methods
You will find 4 ways to register your data
- Automatic mode (let the program try to align your data for you)
- Manual mode (you have full control of how to move each of the images manually)
- Marker mode (define markers on the images and align them)
- Profile mode (use high contrast feature to align horizontally and vertically images)
Tools to help you
Grid
You can add a grid on top of your images to help you in the manual alignment. Click the Grid > display at the top left corner of the UI. Then play with the slider to change the size of the grid.
Profile
You can display the profile of the image selected and of the reference image to help align the images.
Simply move the edge of the profile lines. The profile of all the images selected (+ reference image) will be displayed.
Selection vs Reference slider Image
This slider will show up whenever at least one file, other than the reference image, is selected in the table (bottom of UI).
- When the cursor is at the top of the slider, the mean of all the images selected is displayed (100% of the selection is displayed)
- When the cursor is at the bottom of the slider, only the reference image is displayed (0% of selection is displayed)
- All other positions will display an x% of the selected images and then (1-x)% of the reference image.
The right slider to display current image vs reference image is always available.
Export
By clicking the Export … button (bottom right) you will export the images registered into a folder you select.
For advanced users
All the data registered can be access from the python notebook
     >>> data_registered = o_registration.data_dict
 >>> print(np.shape(data_registered['data']))
(8, 2048, 2048)
you can also reach the list of file names and their metadata
    >>> import pprint
>>> pprint.pprint(data_registered['file_name'])
['/Volumes/my_book_thunderbolt_duo/IPTS/IPTS-19921-Charles/02/im0000.tif',
 '/Volumes/my_book_thunderbolt_duo/IPTS/IPTS-19921-Charles/02/im0031.tif',
 '/Volumes/my_book_thunderbolt_duo/IPTS/IPTS-19921-Charles/02/im0032.tif',
 '/Volumes/my_book_thunderbolt_duo/IPTS/IPTS-19921-Charles/02/im0033.tif',
 '/Volumes/my_book_thunderbolt_duo/IPTS/IPTS-19921-Charles/02/im0034.tif',
 '/Volumes/my_book_thunderbolt_duo/IPTS/IPTS-19921-Charles/02/im0035.tif',
 '/Volumes/my_book_thunderbolt_duo/IPTS/IPTS-19921-Charles/02/im0036.tif',
 '/Volumes/my_book_thunderbolt_duo/IPTS/IPTS-19921-Charles/02/im0037.tif']
>>> pprint.pprint(data_registered['metadata'][0])
{256: 2048,
 257: 2048,
 258: (16,),
 259: 1,
 262: 1,
 270: 'slope = 2.13626E-05 \roffset = 0.00000E+00\r',
 273: (8,),
 277: 1,
 278: 2048,
 279: (8388608,),
 282: 10.0,
 283: 10.0,
 296: 3,
 320: (0,),
 339: (1,)}
