Metadata overlapping images
Description
This notebook allows you to add a dimension scale to your images. You can also add a given metadata value for each of the images, or a graph showing the entire metadata plot and the current image metadata position on this graph.
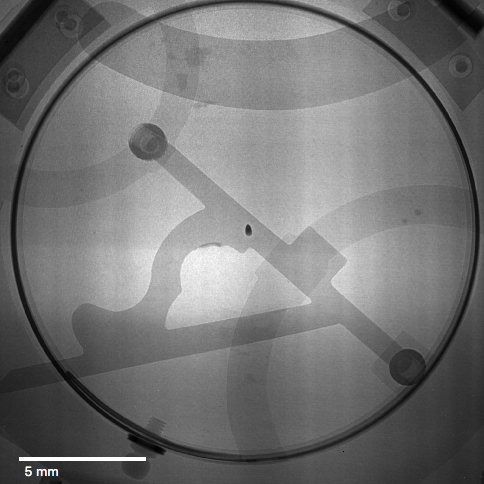
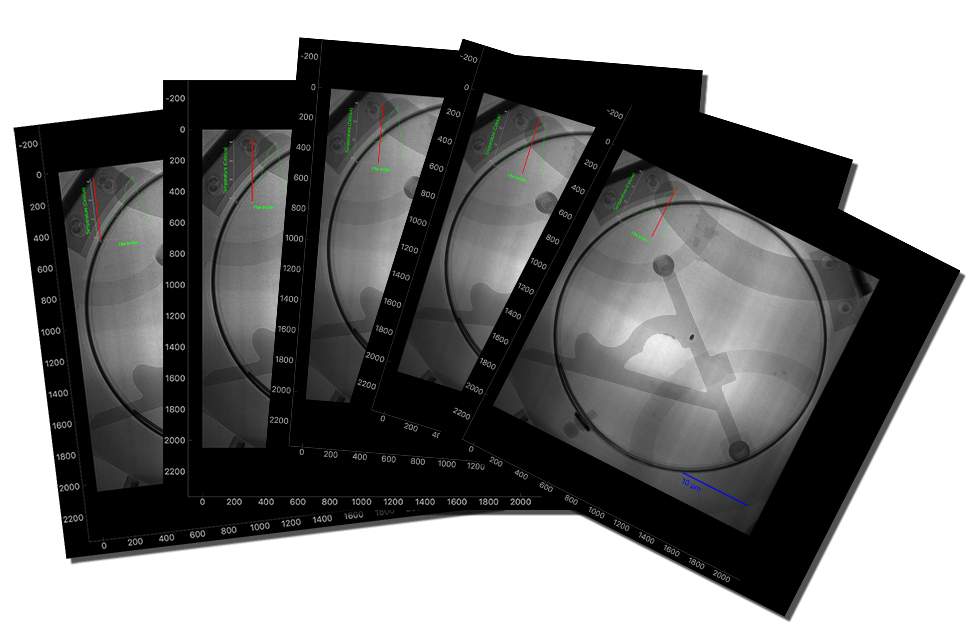
- Scale added on top of an image
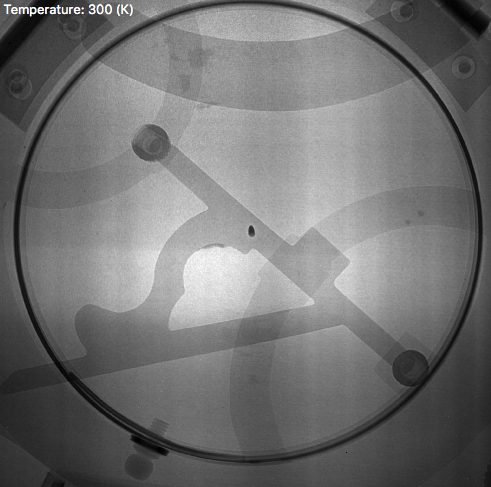
- Metadata of current image
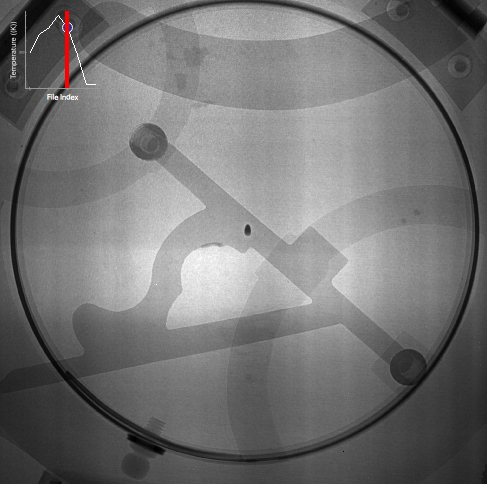
- Graph of all metadata and the current metadata value
Tutorial
Select your IPTS
Need help using the IPTS selector?
Select the images
Using the file selection tool, select the images you want to process. Once you click the Select button, the time stamp and the images will be automatically loaded. Wait for the progress bar to be done.
A progress bar will show you the loading progress. Make sure you wait for the busy signal to go away before moving on to the next cell.
UI presentation
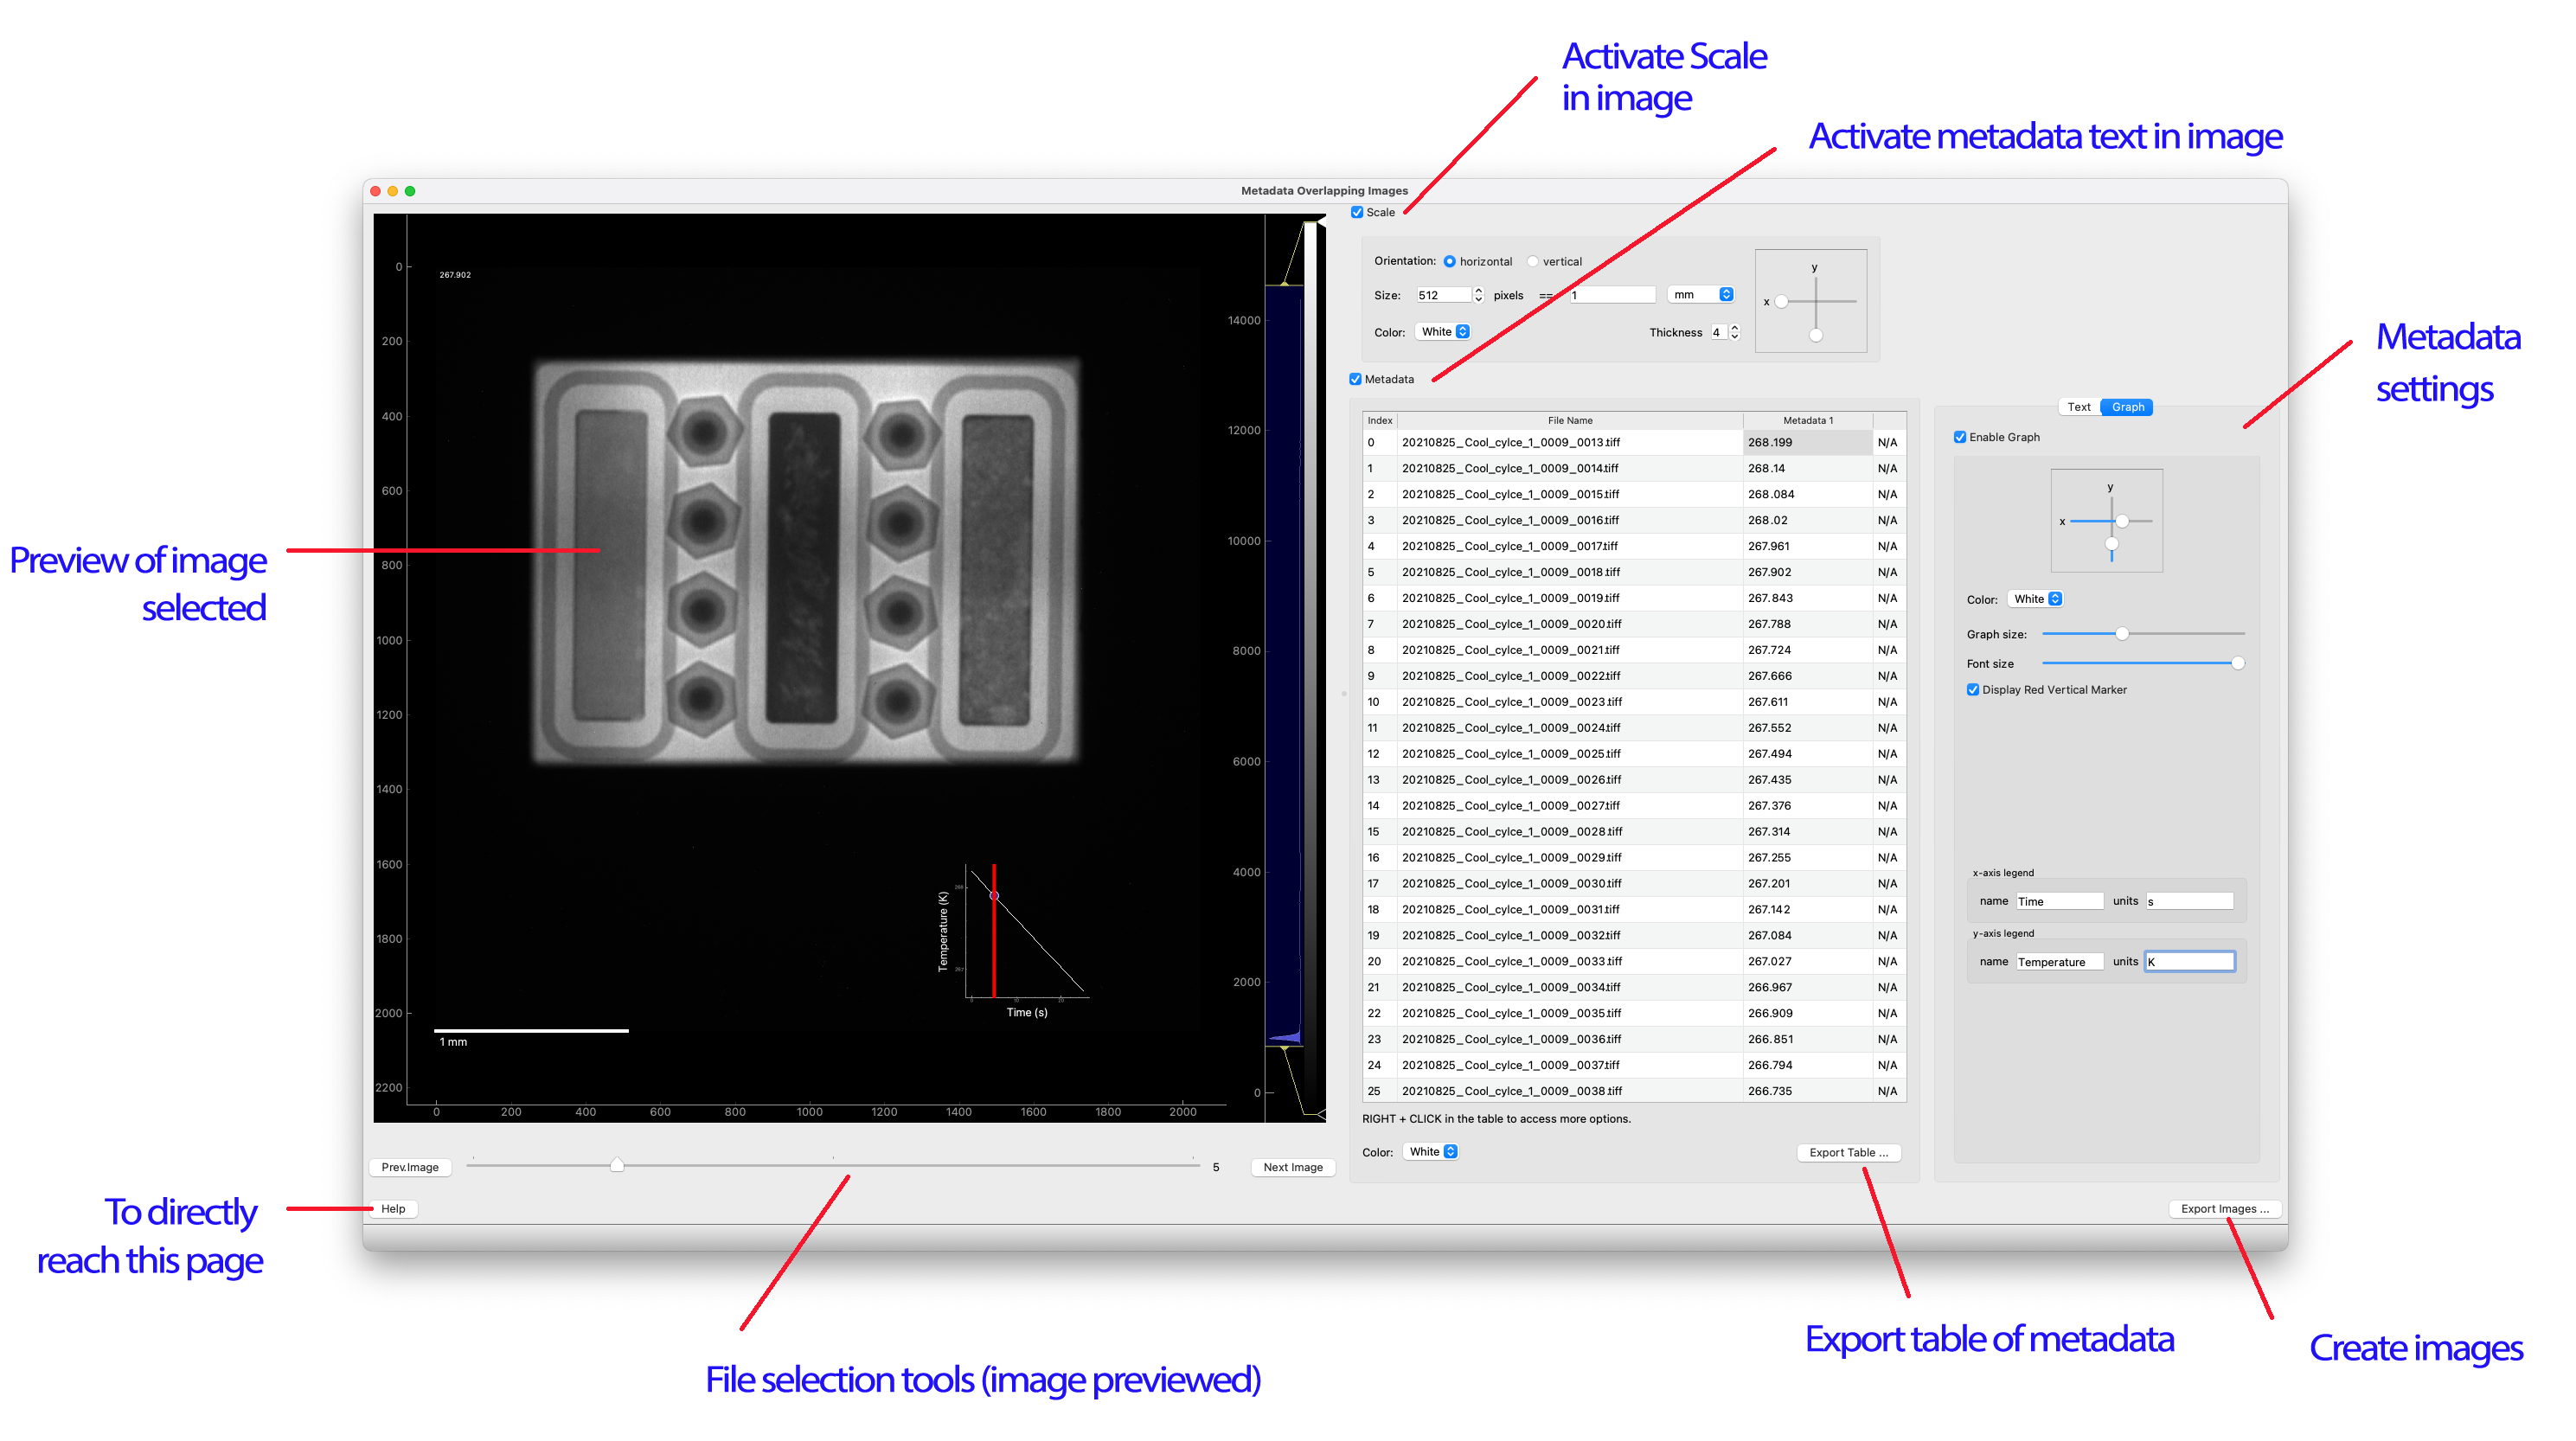
How does it work
scale
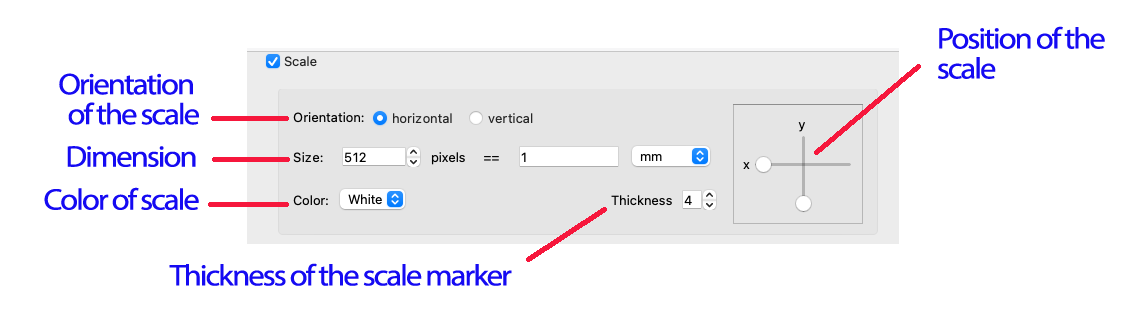
Select the scale option to add a dimension marker on top of the images. You can define:
- orientation of the scale
- size and label
- color
- thickness of the line
- position of the scale/label in the image
Metadata
When using metadata, two features are offered: * you can display and personalize 1 or 2 metadata values on top of the plot * you can also plot metadata versus file index, or versus another metadata
We are going to review each of those features one by one as they each come up with many settings to define.
Displaying the metadata in the image
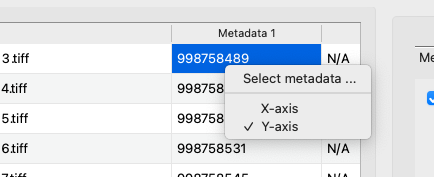
If you want to display on each image 1 or 2 metadata values, use this feature. RIGHT CLICK inside the table and click Select Metadata ….
This will bring the Select Metadata Toolbox.
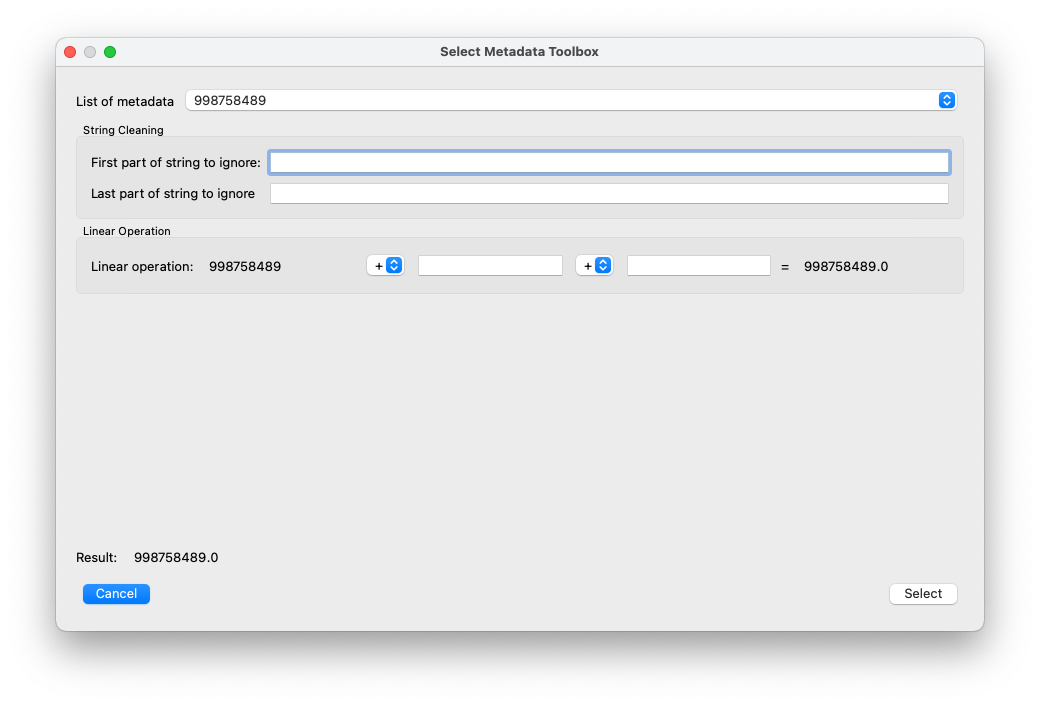
Select first the metadata you want to use. Some of the metadata only have a value, others have a string attached to the value. You can either use the metadata as it is, or if you want to remove part of the string, use the String cleaning widgets to remove some text.
If the metadata, before or after cleaning, can be converted to a float, you have access to widgets that allow you to perform up to 2 linear operations on it. If any equation has been defined, this equation will be applied to this metadata for every single file selected and will be displayed in the final table once you click SELECT.
Settings
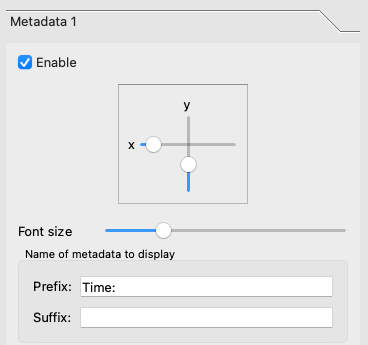
In order to customize the text, you can: * move it inside the image * change the size of the font * add a string BEFORE (prefix) and/or AFTER (suffix)
Plot metadata in image
This plot is used to see the value of the current file metadata over the entire stack of images selected. For example, in the case of a sample where the Temperature changes over time, this plot will show the current temperature of the image as well as the temperature of all the images.
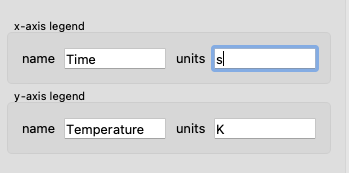
It’s possible to change the default x-axis (file index) to any of the 2 metadata. RIGHT CLICK and click X-AXIS or Y-AXIS.
You can define the legend of each axis using the settings widgets.
Export table
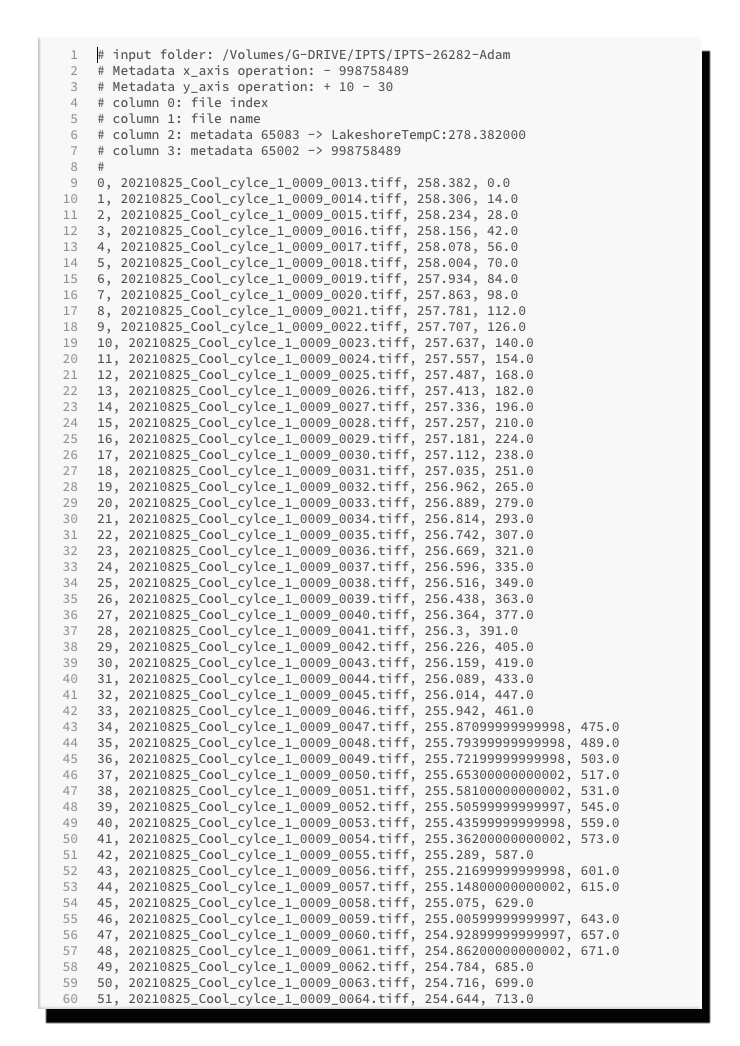
You can export the table into an ASCII file. Click Export Table … and select the output folder.
Export
You can now export all your images. The PNG files created will be a copy of the current UI image preview. Click Export Images … at the bottom right and select the location where you want to create the images.
Use relative time as metadata. Some of the metadata does not have a meaningful name. For example, the acquisition time is recorded in Linux format and can be found here (see screenshot). To get the relative time of each image, remove the acquisition time of the first image via the linear equation.