Automatic Normalization
Description
This notebook normalized the imaging data (tiff or fits) by removing the background and fixing the fluctuations of the neutron beam. You will need to follow these steps:
- select your sample images folder
- Select the OB from the list proposed
- select the output folder where the normalized images will be saved
The big improvement of this notebook compared to the old normalization notebook is that now, the notebook takes care of finding all the OB and DF for you, and matches them with your sample data by making sure that:
- the slits have the same position
- the acquisition time is identical
- the detector type is identical
Tutorial
Select your IPTS
Need help using the IPTS selector?
Select the sample images
Using the folder selection tool, select the folder containing the data you want to normalize.
Simply navigate to the folder containing all the data your want to normalize. The program will then list the files with the most dominant extension, for example, if you have a folder with 10 tiff images and 2 fits, only the 10 tiff images will be used. All the sample images will be grouped according to the following criteria:
- acquisition time
- slits positions
- detector type
The notebook will then retrieve all the OB and DF of the same IPTS by looking into the /raw/ob and /raw/df folders respectively of your IPTS folder. The OB and DF that match the sample criteria will then be associated with their sample data.
At that point, you have the power to finalize the selection:
- For each configuration, you can reject it from normalization by turning off the switch named Normalize this configuration
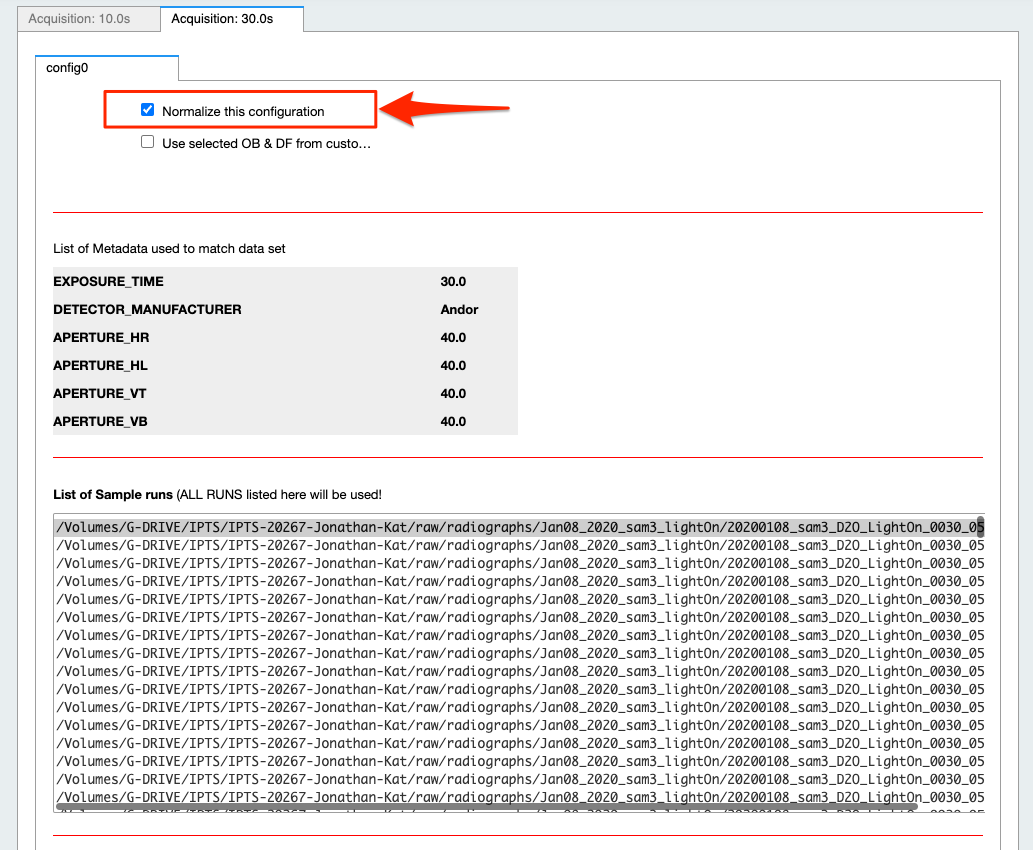
- The list of OB proposed includes ALL the OBs found with matching metadata (see above) in the corresponding IPTS, no matter how long before or after they were acquired. By default, they are all selected in the list widget. Feel free to narrow down that selection by manually selecting them (see next animation).
- You can also narrow down that selection by setting up yourself a time range before and after the sample data runs (see the next animation)
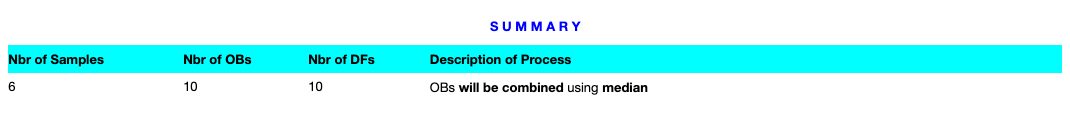
- According to the number of samples and open beams loaded, you may have the option to combine the open beams or not, and to provide the algorithm to use to combine them.
Here is the possible scenario:
- there are as many sample and ob data. You can either combine the OBs or not. If you choose not to combine them, each sample will use 1 OB.
- the number of samples and ob is different, you don’t have the choice to combine or not, but you can select how the OBs will be combined, either median or mean.
A table at the bottom of the cell will summarize the state of that normalization.
ROI selection
In order to improve the normalization, you have the option to select a region of interest (ROI). This ROI must be a region of background only in your sample image. The algorithm will then use the difference in intensity in the background of the sample and the same region in the open beam to get a coefficient that will be applied to the normalization.
To do so, click the Selection of the region of interest (ROI) – OPTIONAL button. Use the user interface that just popped up to make your selection, or just close it if you changed your mind.
If you need help using the ROI selection tool, check this tutorial.
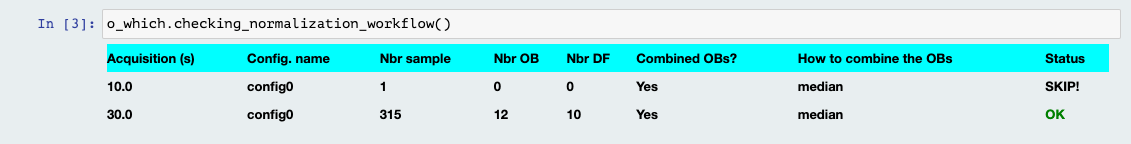
Normalization Workflow
This table will summarize the data reduction that is about to take place. If a config has no OB, the table will let you know that this config won’t be normalized unless you provide at least one OB. Also, if you decided to turn off the normalization of any particular config, you will see it in that table.
Select output folder
Select the output location using the folder selection tool. This is where you want all the normalized folders to be created. Then a message will let you know when the normalization is done and the name of the files created.
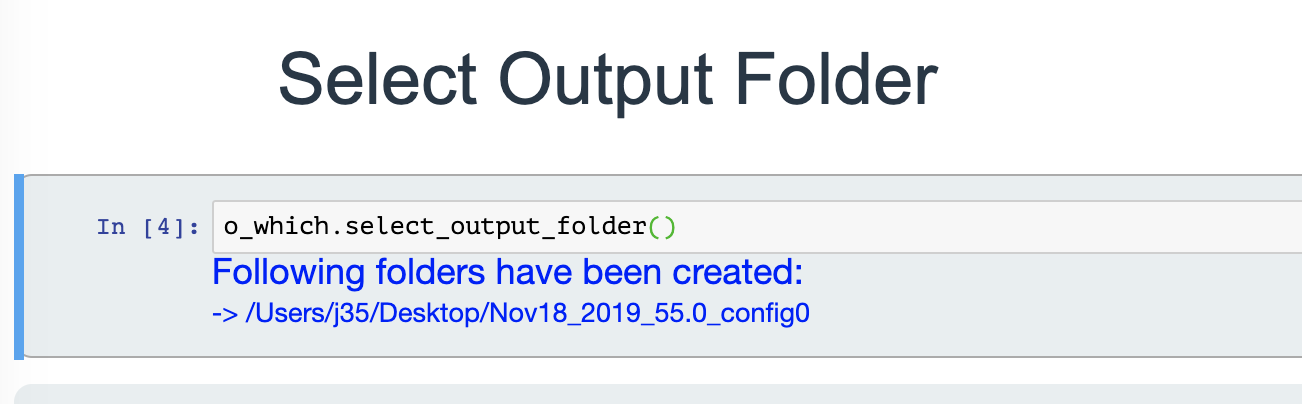
If the output folder already exists, the current date and time will be prefixed to the folder name to make sure the previous folder is not replaced!
