Circular profile of a ring
Description
This notebook will create an ASCII output file of the average counts of the pixel within a given ring versus angle position. The top vertical is the angle 0 and goes clockwise.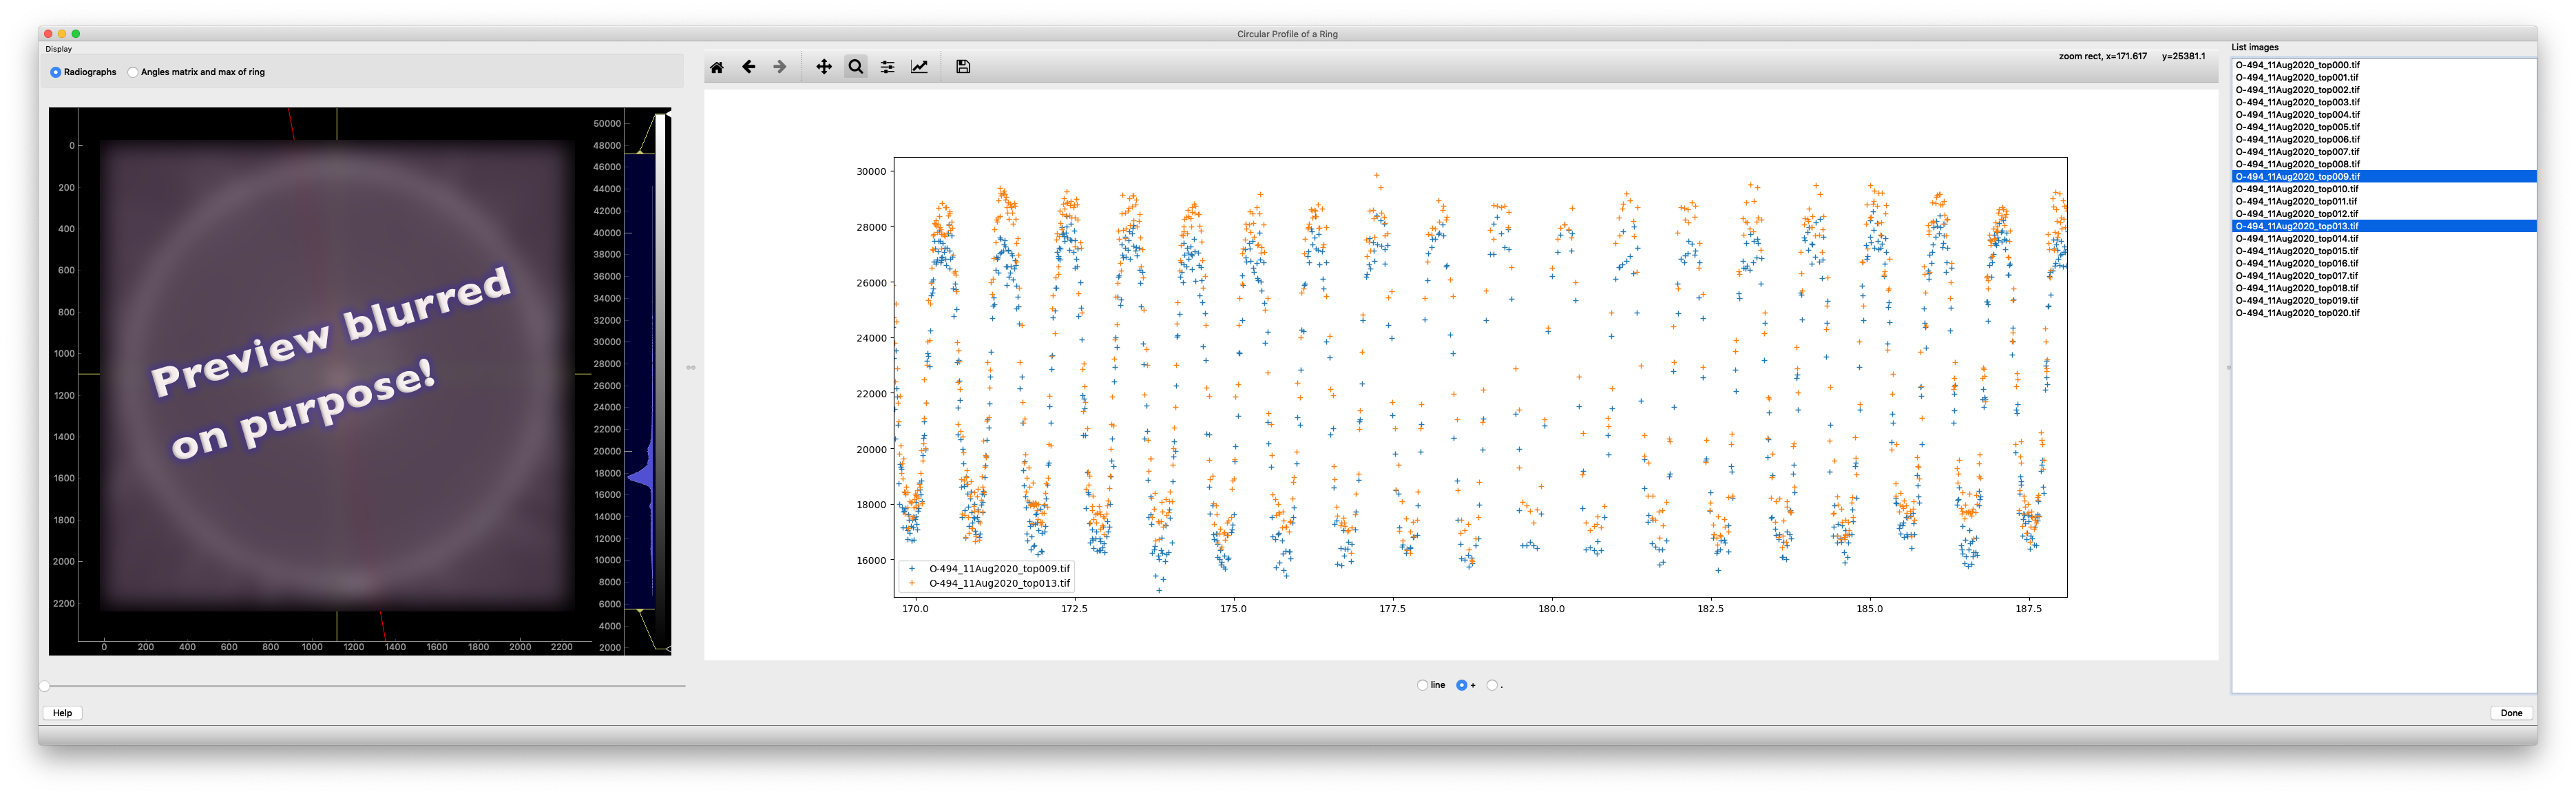
Tutorial
Select the IPTS
Need help using the IPTS selector?
Select the images
Using the folder selection tool, select the folder containing all the images to get a profile from. The radiographs will be loaded in memory and a progress bar will display the progress of the loading.
Launch the user interface
The user interface contains 3 main parts: * on the left – preview of the radiographs loaded + grid + ring selection * on the right – ring, grid, and angle bin settings * hiding in the slider on the far right – the result of circular profile of the ring.
Ring selection
Using the mouse + left click, you can move the ring around and use the grid tool (size and color can be modified) in order to place with high precision the center of the ring. Feel free to use the mouse wheel to zoom in and/or out the image.
Then you can modify the ring size using either the mouse directly on the plot, or the widgets on the right of the preview. Via the plot, click and little square box on the bottom right of the ring to change the size of the ring. You can also play with the inner radius slider on the right to change the size.
To change the thickness of the ring, play with the thickness slider on the right of the preview.
Angle cursor
It’s possible to measure the angular position of any element relative to the custom center defined by playing with the angle cursor widgets.
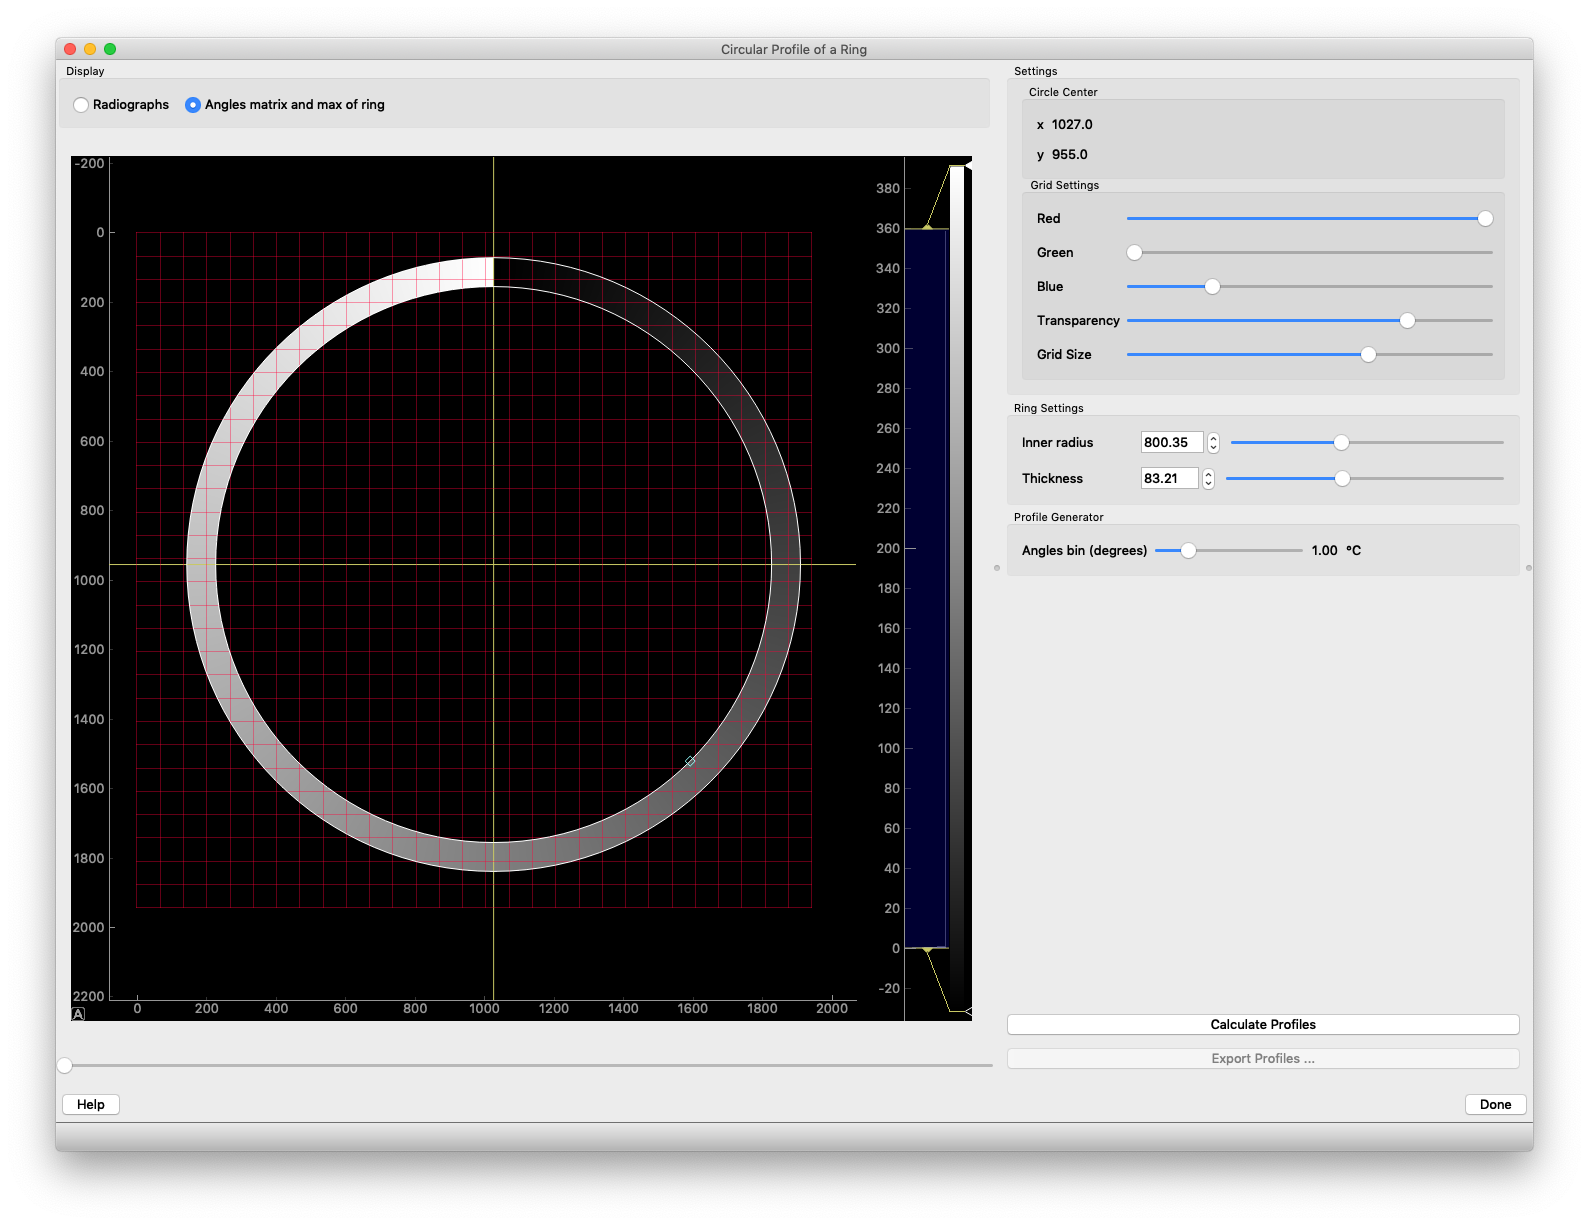
Profile generator tool
The notebook will create a table of counts versus angles. The angles bins (degrees) slider allows you to get a thinner or coarser profile. To visualize the angle value of each pixel of the ring, click the “angles matrix of ring” radio button on top of the preview image.
Calculate profiles
Click the calculate profiles button to produce the profile of the ring. A progress bar displayed at the bottom of the UI will show the progress of the calculation as the program extracts the profile for every single radiograph you loaded.
how is the profile calculated?
The following diagram will help explain the math behind the profile calculation.
In order to calculate the angular position of every single image relative to the top vertical position, the center of the pixel is used. Each center gets an angular value. Then when the angular axis has been defined by playing with the angular bin, every pixel is associated with the closest angle value. If more than 1 pixel falls in the same angle bin, the average of all the pixel counts in this bin is used.
![]()
In the previous figure,
- pixel a and b are part of the same angular bin and the average of pixel A and B will be used for that angle
- all angles are calculated by using the center of the pixels as shown in figure d
- pixel c has its center outside of the ring and then, won’t be used
Once the process is done, the right part of the UI will expand and display the list of images loaded. Select any, one or more, of those images to display the profile of mean counts versus angle value.
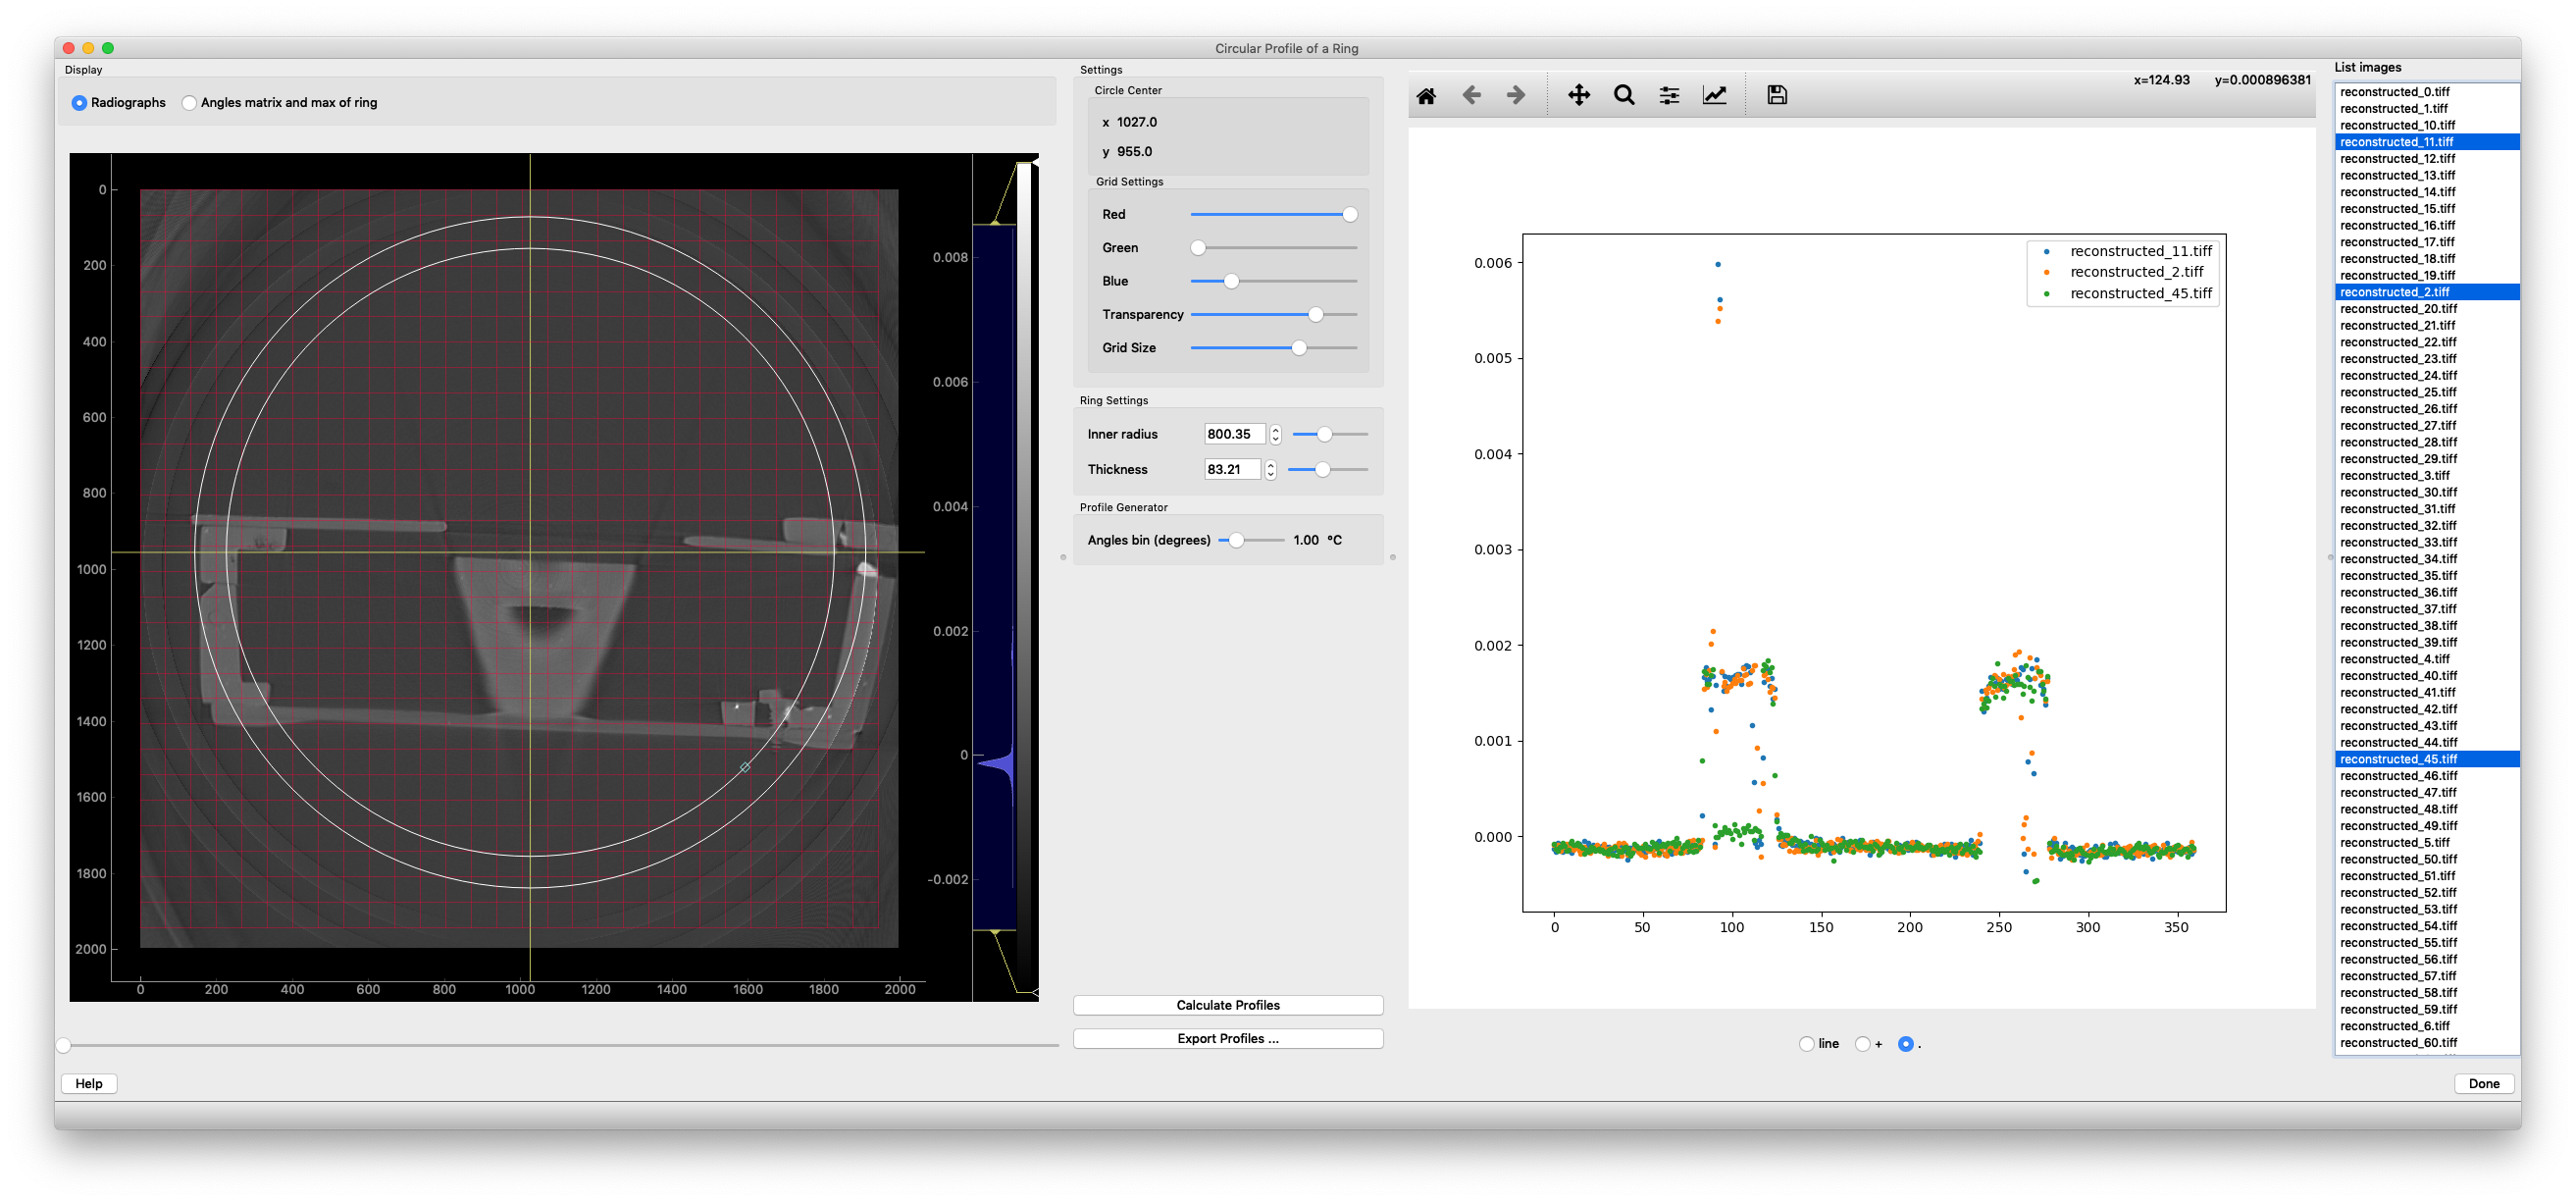
Feel free to play with the plot style widgets, as well as zoom and pan of the plot.
Browsing the profiles
It’s possible to quickly locate the element position calculated by the algorithm by clicking the profile plot. The angular position of that point will be displayed on the left display.
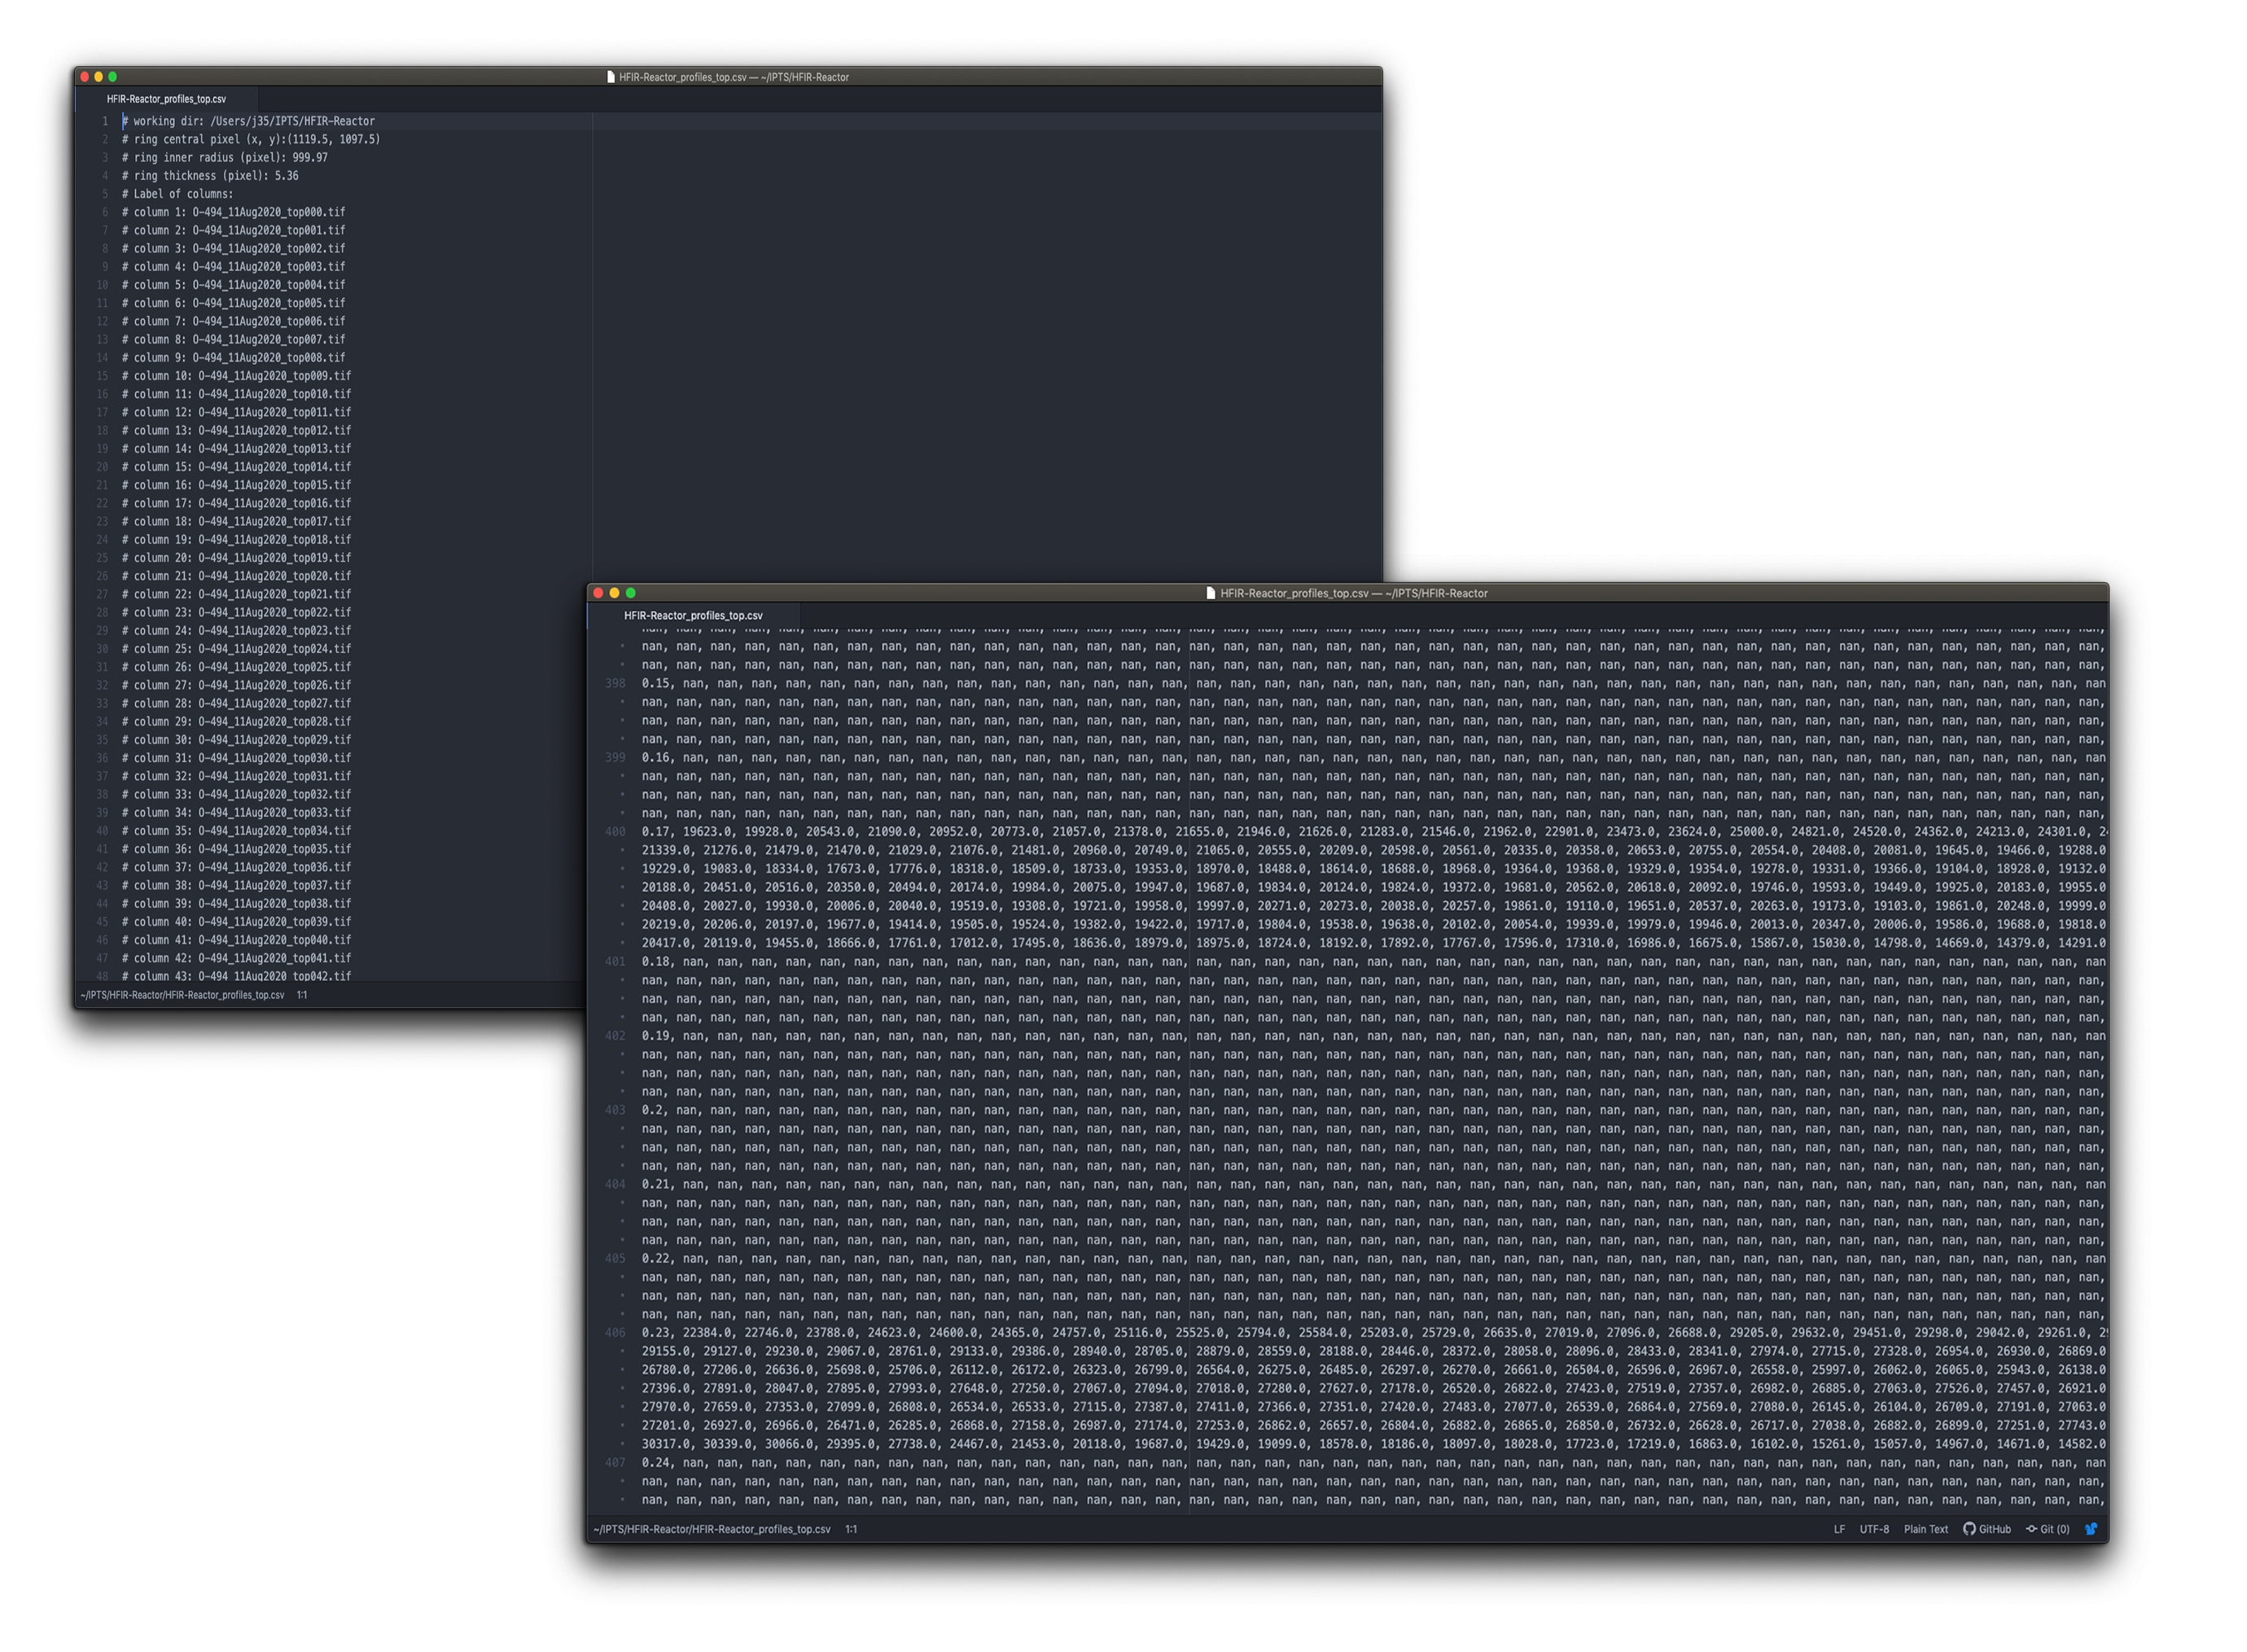
Export profiles
Once you are done, click export profiles … to export the profiles data into an ASCII file.
