Bragg edge – normalized sample and powder
Description
The main goal of this notebook is to display the ideal Bragg Edges of a list of elements and compare their signature to the signal of a set of FITS (MCP data) taken. The experimental setup can be changed by:
- distance source-detector
- detector time offset
Tutorial
Select your IPTS
Need help using the IPTS selector?
Select the working folder
Using the folder selection tool, select the working folder. If the time spectra file is part of the folder, it will be automatically loaded, if not, you will have the option to select the time spectra file next.
Selection of sample within the image
In order to calculate the signal of the loaded images, you must define the location of your sample in the image. But before doing so, the program will need to load a random subset of those images. You will need to define how many images you want to use to select that sample. A subset has been defined for you by default. Using this value (N), the program will load N images randomly chosen within the list of images in the working folder.
Remember The more images you want to load, the longer it will take.
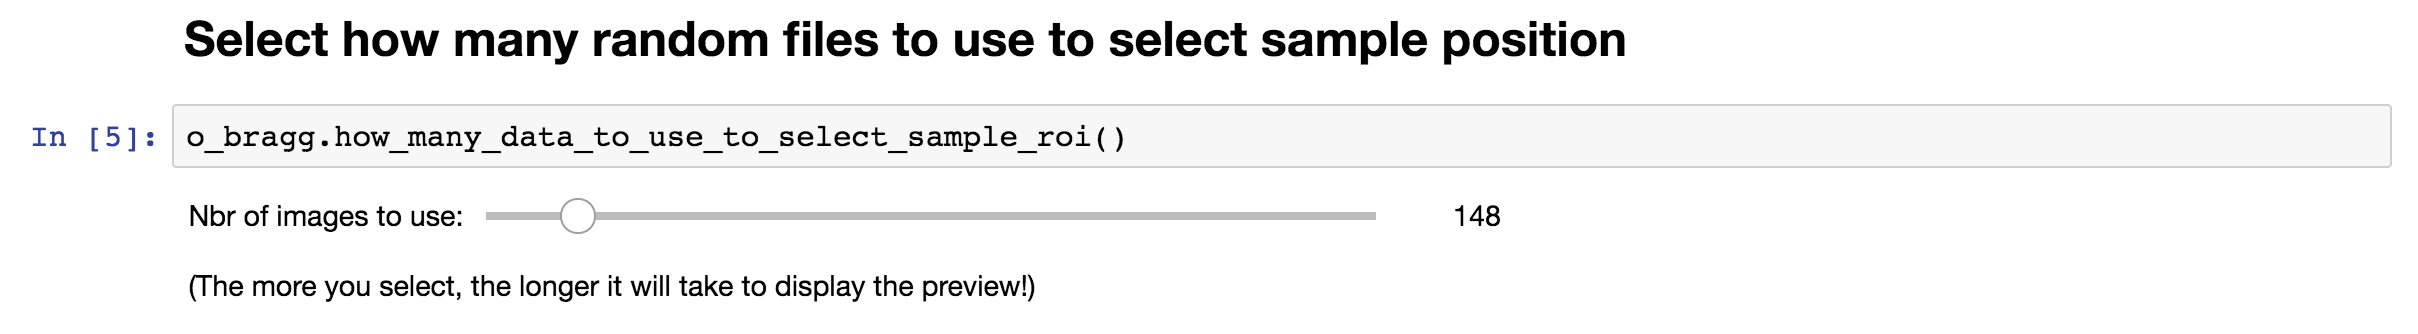
Once this subset has been defined, running the next cell will bring a user interface that will allow you to define the location(s) of your sample.
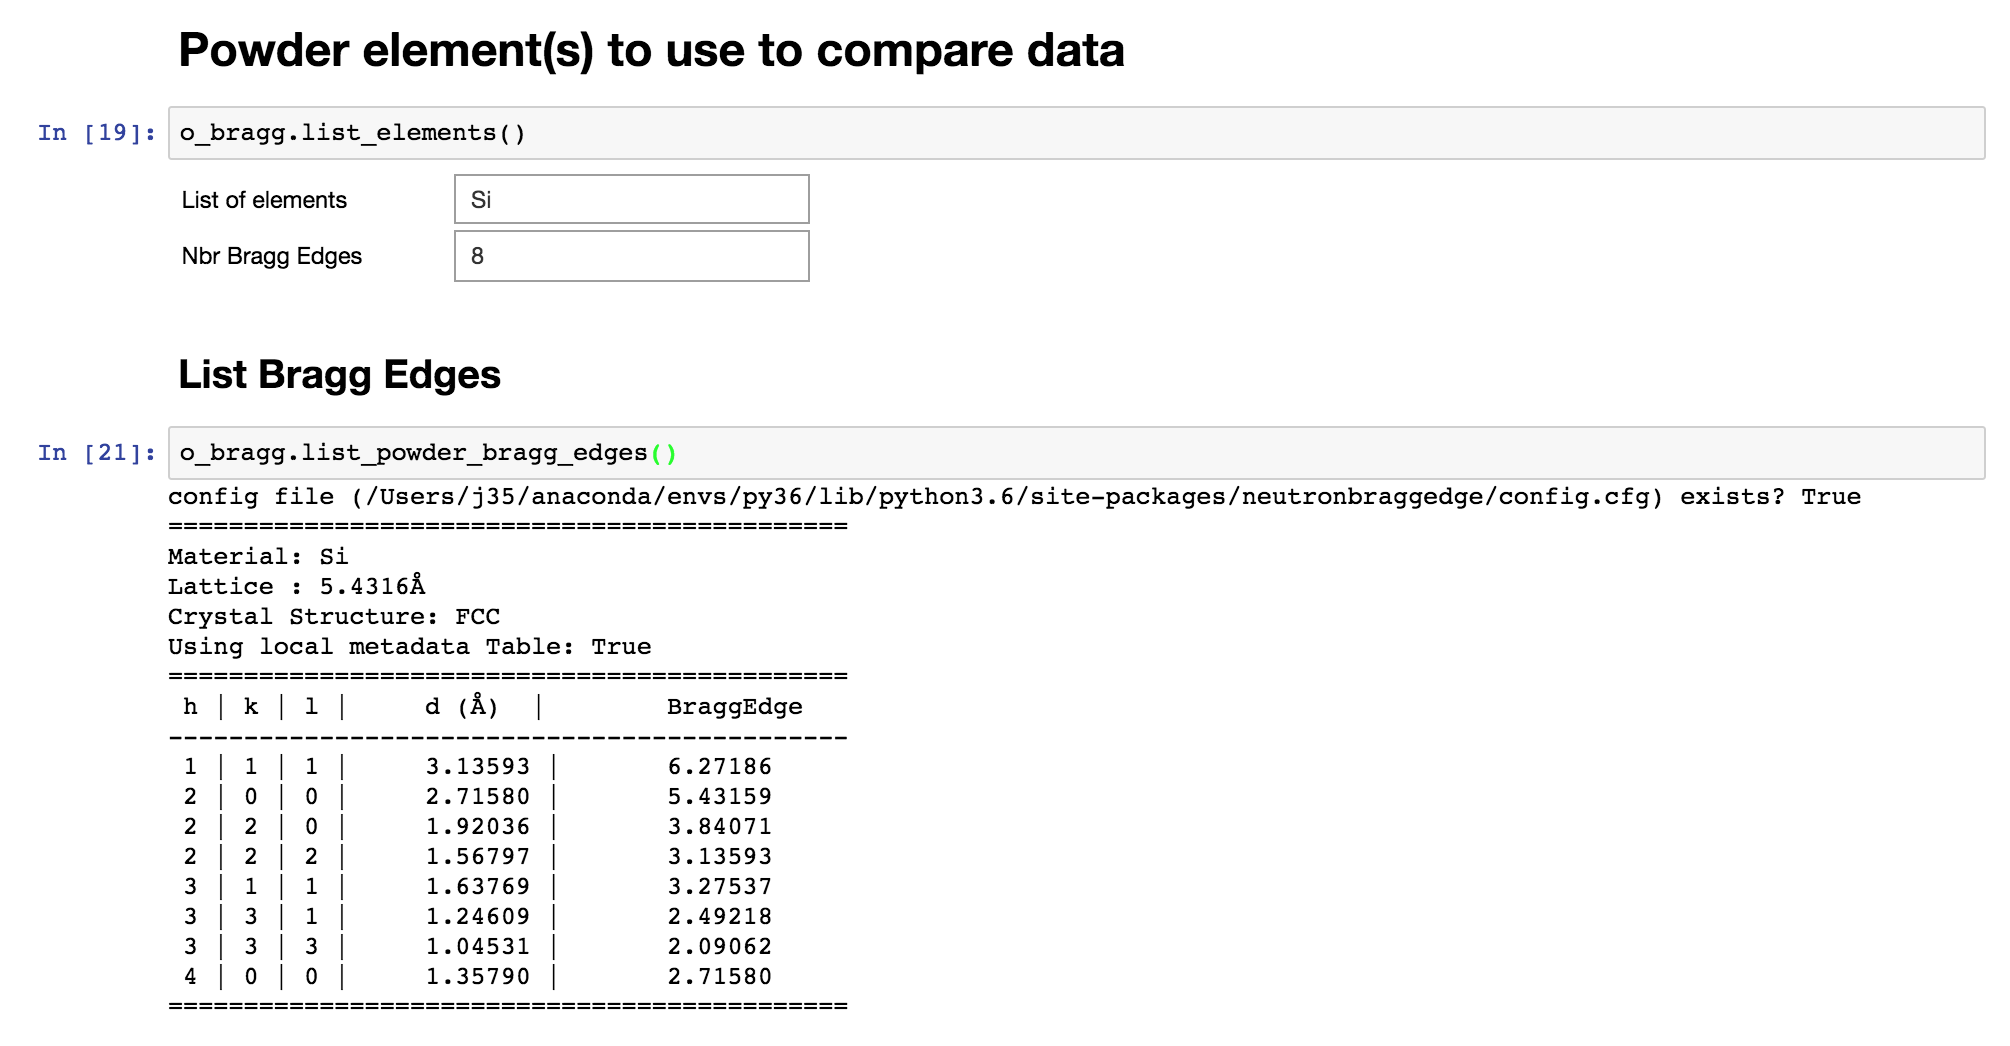
Select Powder elements
It’s now time to select the powder elements for which you want to see the Bragg Edges on top of your signal.
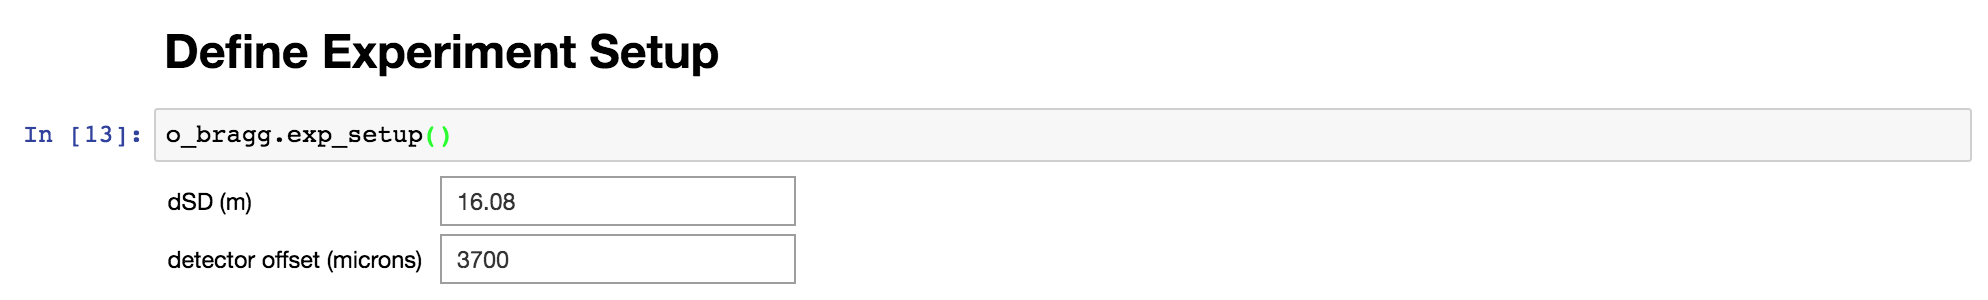
Define experiment setup
This is where you can set up your experiment and play with these values to make sure the Bragg Edges of the reference powder elements show up at the right lambda in your signal data.
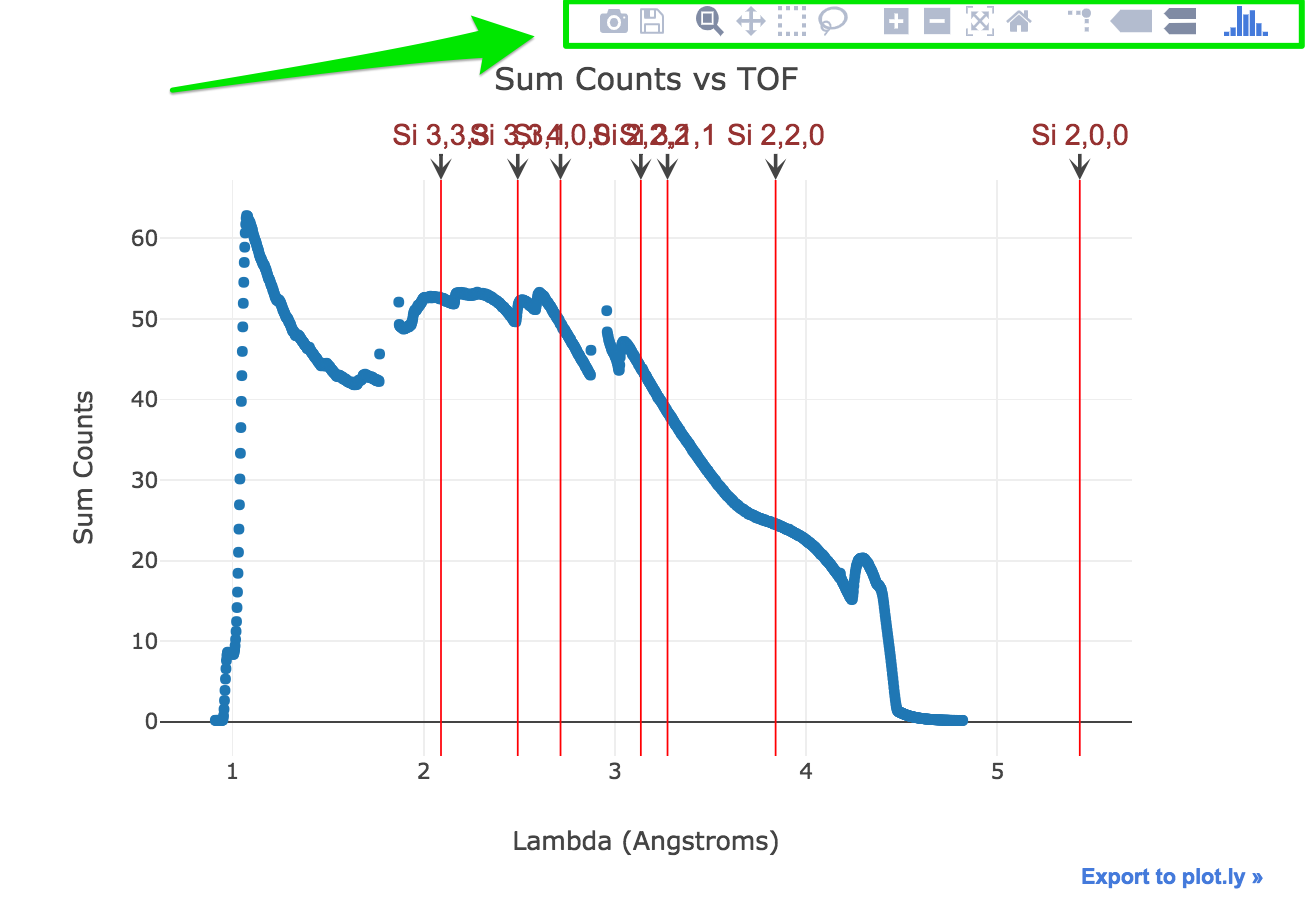
Display Bragg edges vs raw signal
Feel free to play with the iPlot widgets (above the plot) to zoom, pan, … etc