Integrated ROI counts vs file name and time stamp
Description
This notebook will create an ASCII file with the following information
- file index
- file name
- time stamp of the file
- Mean or total number of counts of each region of interest for each image
Tutorial
Select your IPTS
Need help using the IPTS selector?
Loading the images
Using the file selection tool, select the images you want to work on.
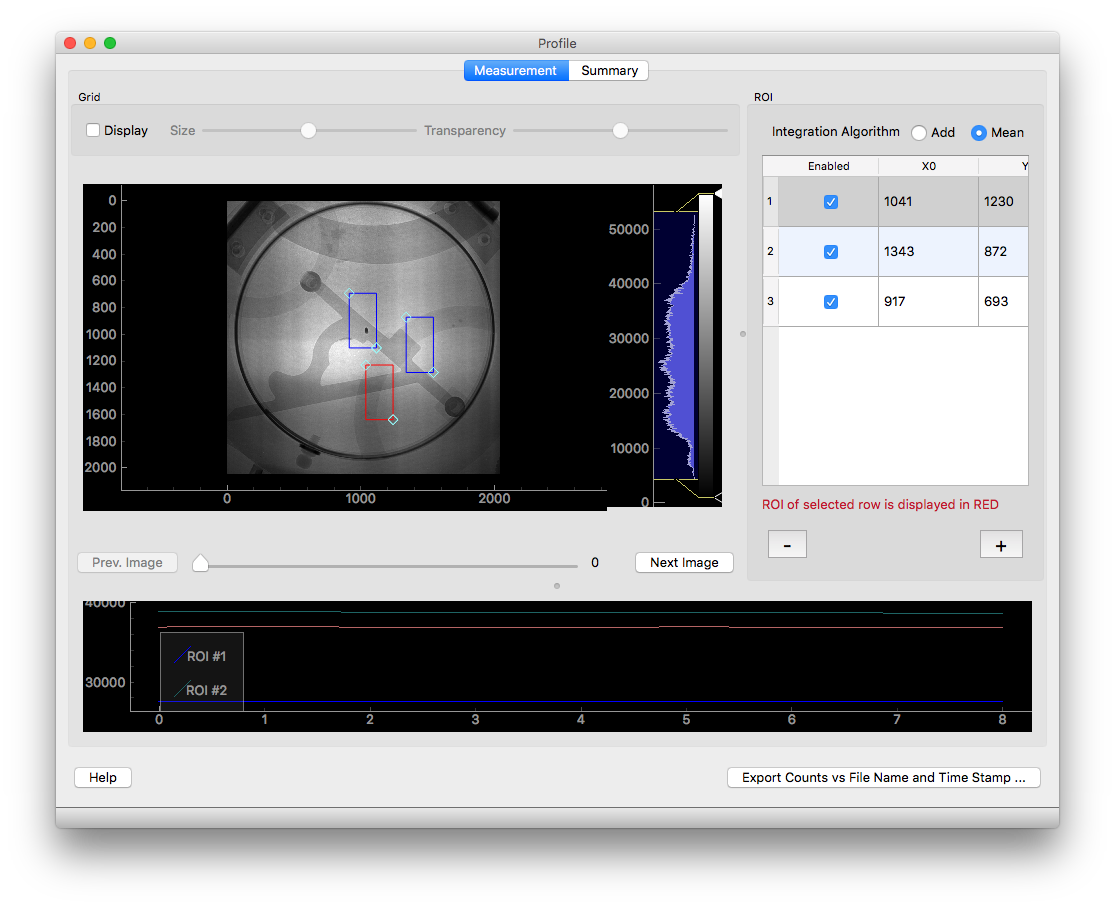
Presentation of the UI
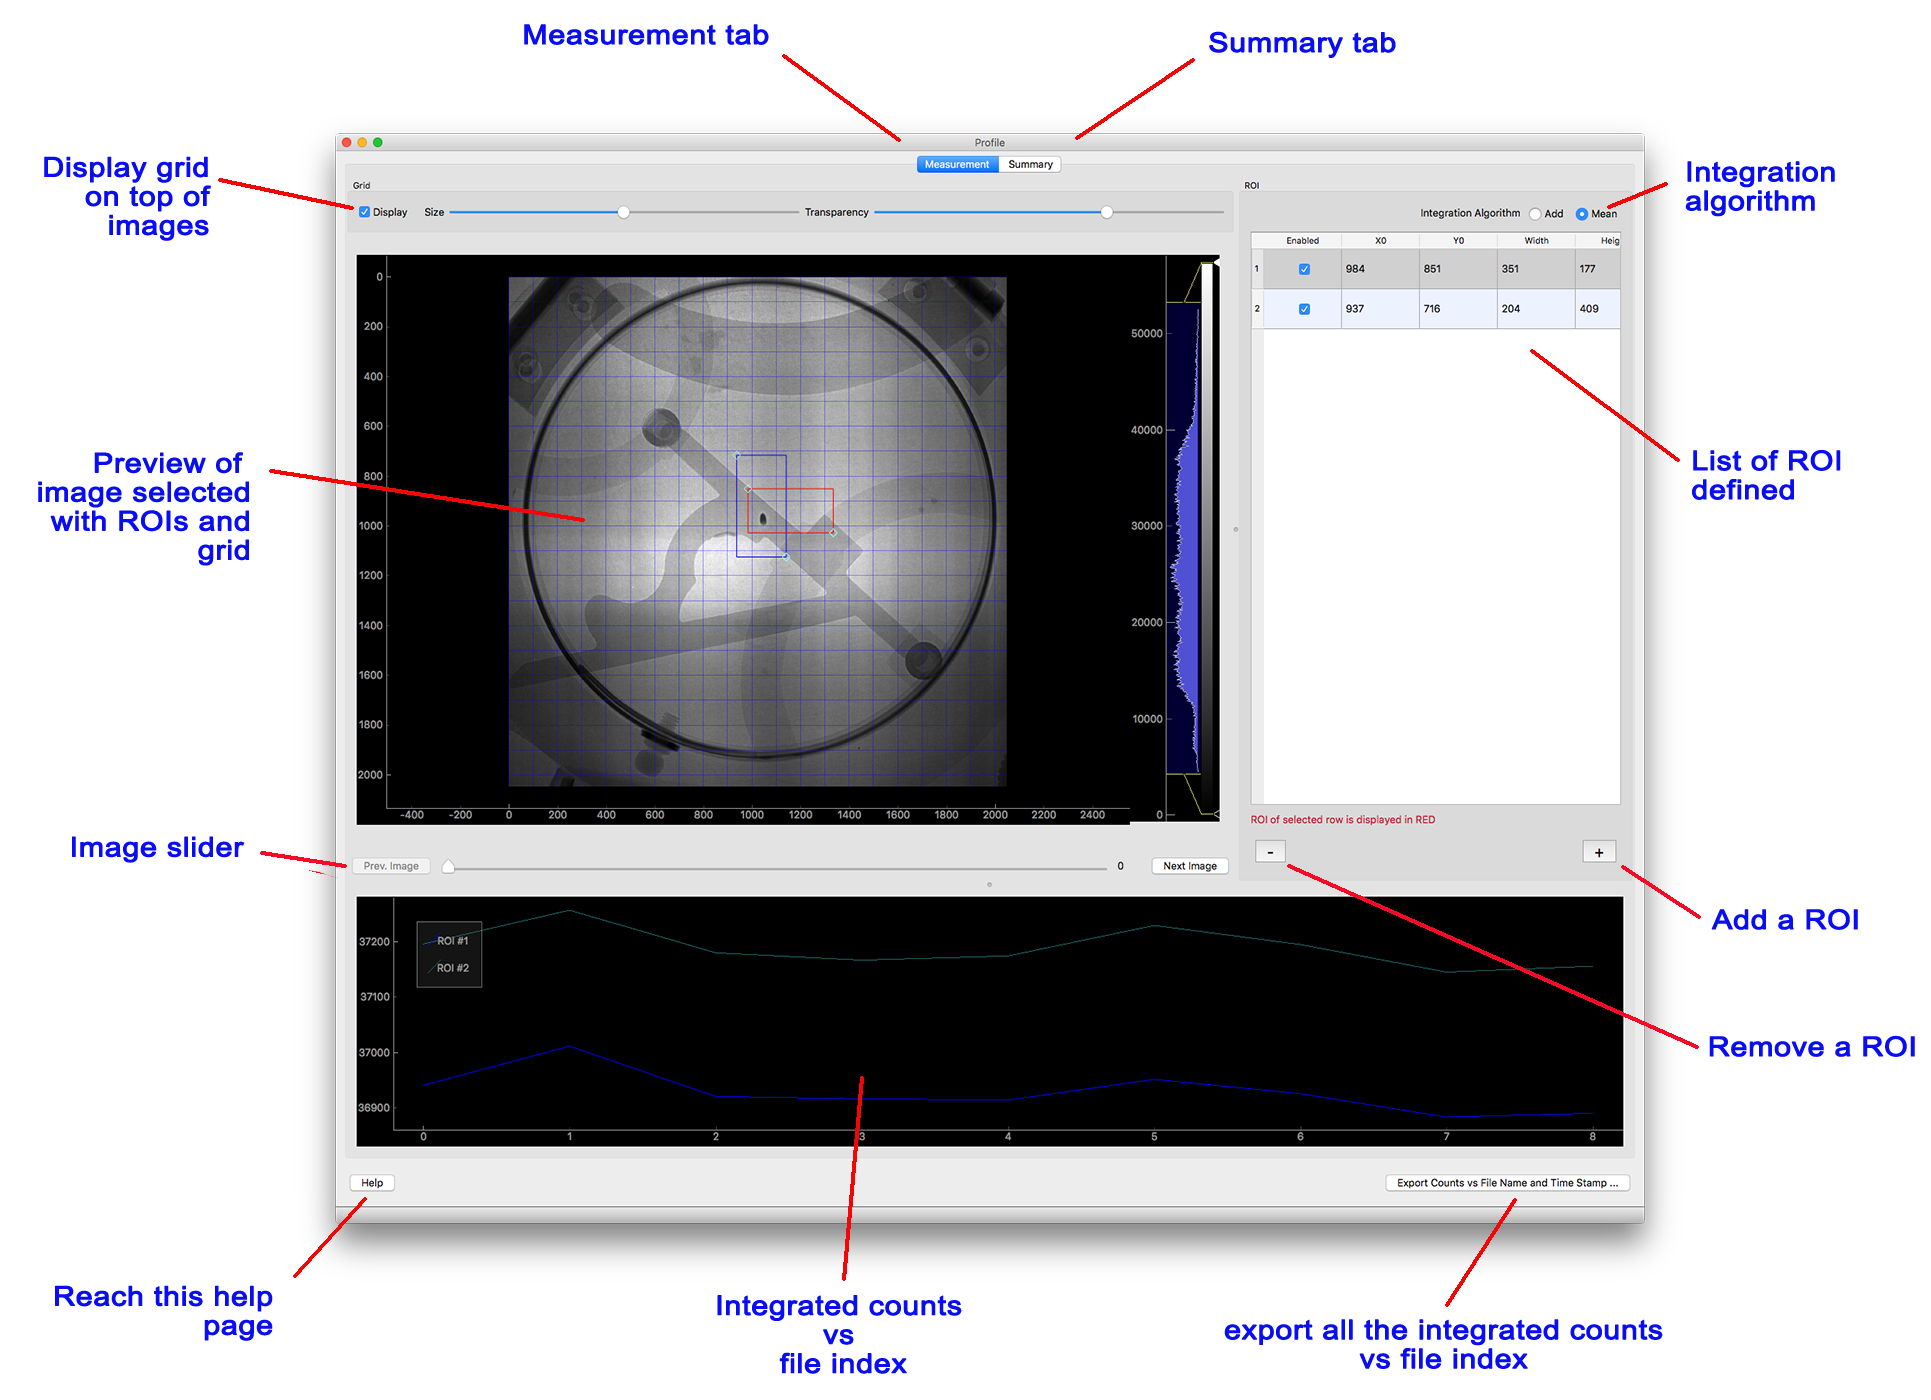
Step by step
ROI selection
You have the option with this UI to select more than one region of interest (ROI). Click the + button on the right to add an ROI, and – if you want to remove the ROI selected. You can also enable or disable any of the ROIs.
To modify any of the ROI, you can either:
- move or resize the ROI directly from the Image window
- manually change x0, y0, width or/and height in the ROI table
The total counts vs file index plot will be updated live as you modified the ROI. This plot displays the mean or total counts of the ROIs for each image (1 image = 1 data point),
Integration Algorithm
The current implementation provides 2 algorithms to integrate the counts within each ROI
- Add – sum counts of all the pixels in the ROI
- Mean – average counts of all the pixels in the ROI
The total counts vs file index plot will be updated live as you change the algorithm.
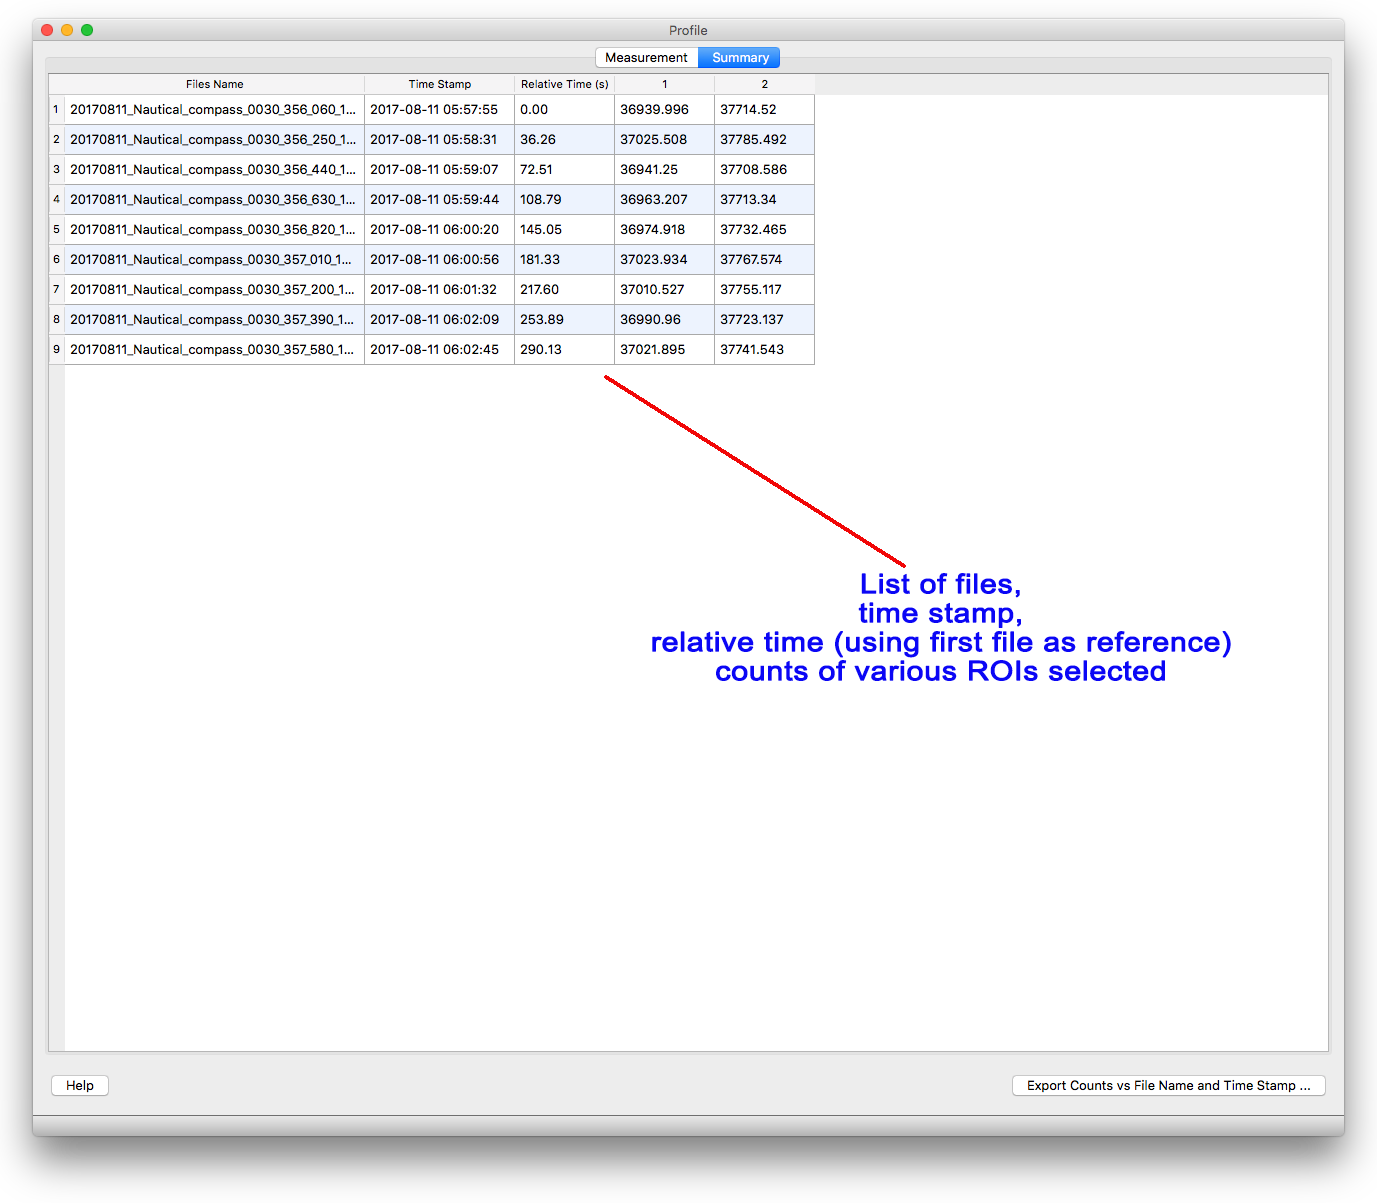
Export the counts vs file name and time stamp information
Click the Export Counts vs File Name and Time Stamp … button to create the ASCII file version of the data found in the Summary Tab table.
The following 3 images show an example where 3 ROIs have been created, how the summary tab looks like and the final output file created.