manual normalization
Description
This notebook normalized the imaging data (tiff or fits) by removing the background and fixing the fluctuations of the neutron beam. You will need:
- select your images
- select your open beam (OB)
- optional – select the dark field (DF)
- optional – select one or more background regions in your sample images
- run the normalization
- select the output folder where the normalized images will be saved
Tutorial
Select your IPTS
Need help using the IPTS selector?
Select sample data
You need to provide the list of samples, OB, and DF (if needed). To do so, just SHIFT + ENTER the following cell to display a selection tool wizard.
The dialog box will start listing the files from the IPTS folder you selected in the first cell. Feel free to navigate to find your data set.
Check the file selection tool tutorial to learn how to use that selection tool.
- Select your sample images
- Click Next Step>>
- Select your OB images
- Click Next Step>>
- OPTIONAL Select your DF images
- Click Next Step>> to let the program load all your images.
Select background region
SHIFT + ENTER to run the cell. A new User Interface (UI) will come to life. If you can not see the UI, check behind the notebook window.
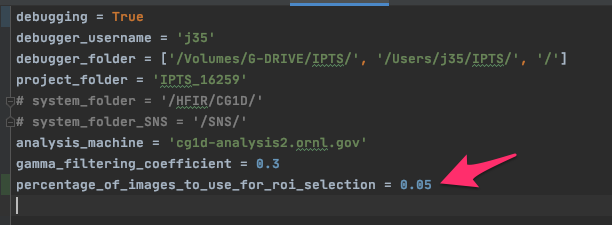
In order to speed up the display of the data, the notebook randomly selected 5% of the stack of sample images selected. If you want to change that coefficient, edit the config.py file found in the __code folder and change the variable value called percentage_of_images_to_use_for_roi_selection.
Just click OK if you do not want to select any region of interest (ROI).
If you want to provide one, or more, ROI, click + on the right of the GUI and move/resize the ROI using the mouse, or the table values.
Settings
This is where you specify if you want to combine the OBs, and how they will be combined.
Depending on the number of sample and OB you loaded, the widgets will adapt.
- if the number of samples and OBs do not match, the OBs will be automatically combined using the algorithm you select here, mean or median.
- if the number of samples and OBs match, you have the option to use 1 OB for each sample (match will be done via alphabetical order), or to combine all the OBs. Again, you can select mean or median.
A table, the last tab of the accordion widget, will summarize how the OBs will be combined in the next cell.
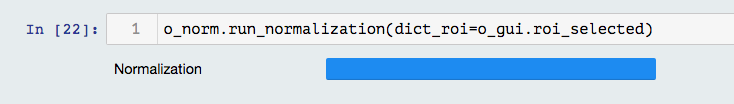
Normalization
This cell runs the normalization and lets you know the progress of the calculation via a progress bar.
Export
Select where you want to output the normalized data, then run the following cell. Once the output folder is selected, a folder name after the input data folder is created and will contain all the normalized data.
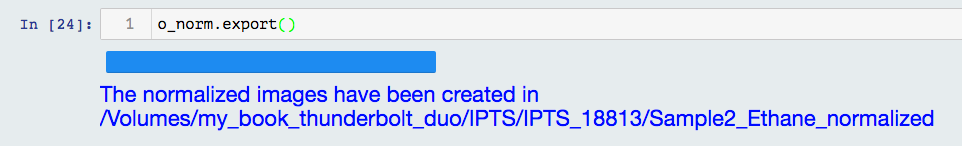
If the output folder already exists, the current date and time will be prefixed to the folder name to make sure the previous folder is not replaced!
