Timepix3 – From event to histo HDF5
Description
This notebook load an event HDF5 created by timepix3 and will output a histogram HDF5 file.
Tutorial
Select your IPTS
Need help using the IPTS selector?
Select the event HDF5 file to use
Using the file selection tool, select the event HDF5 file.
Once the file has been selected, you get a preview of the file structure.
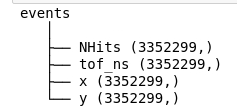
Manually loading the data
This is where you manually need to specify the file path to reach the x, y, and tof arrays.
for example, in this case, the path is events/x, events/y, and events/tof_ns respectively. The 3 arrays must then be specified as followed:
    with h5py.File(o_event.input_nexus_file_name, 'r') as nxs:
    o_event.x_array = np.array(nxs['events']['x']
    o_event.y_array = np.array(nxs['events']['y']
    o_event.tof_array = np.array(nxs['events']['tof_ns']
Some statistics
Running this cell will display some statistics from the event HDF5, such as min and max values for each array, as well as the total number of events. 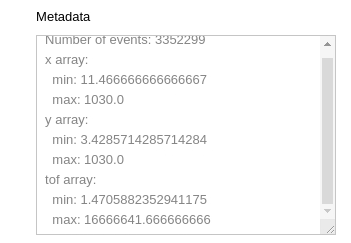
Define the MCP detector size
This is where you define the size of the detector. This will then exclude all the x and y outside that range. 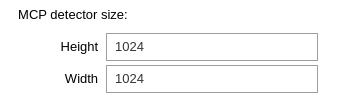
Binning data (Zzz)
Select the number of bins you want to end up with, as well as the percentage of events data to use.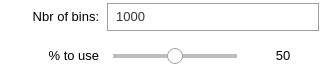
Run the next cell to start binning the data.
The higher the percentage, the longer it will take to rebin the data. This time will of course depend on the number of events you have to start with.
Display integrated stack
This display the integrated signal. That means all the bins are added on top of each other. 
Display slices
You can also preview each bin (slice) running this cell. Feel free to change the index (slice #) using the slider. 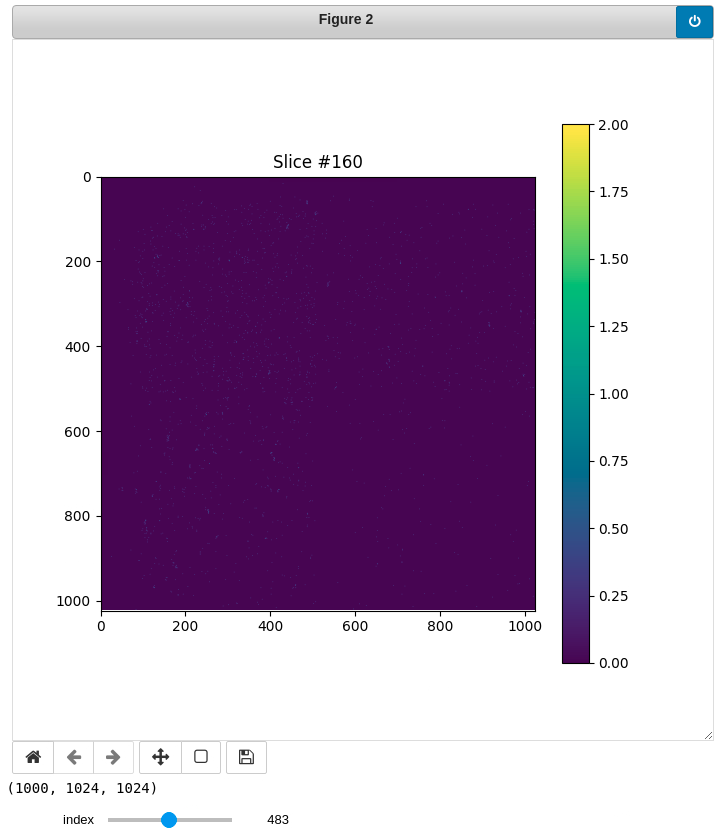
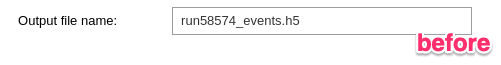
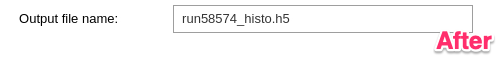
Export Histogram HDF5
1- Run the first cell to define the output file name (by default, the input event HDF5 file name is given).
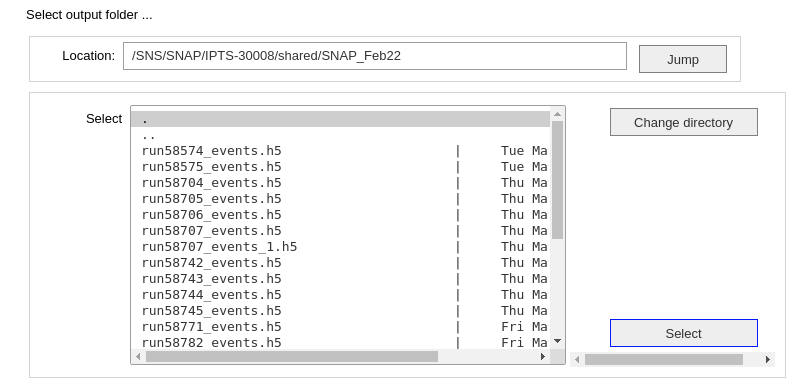
 2- Run the next cell to use the folder selection tool to define the output folder where the HDF5 histogram file will be created.
Demo of a full running session