From attenuation to concentration
Description
This notebook takes normalized data (attenuation mode) as input and will apply an attenuation formula to the data. The data are then exported as TIFF. The formula converts attenuation into concentration values.
How to use it?
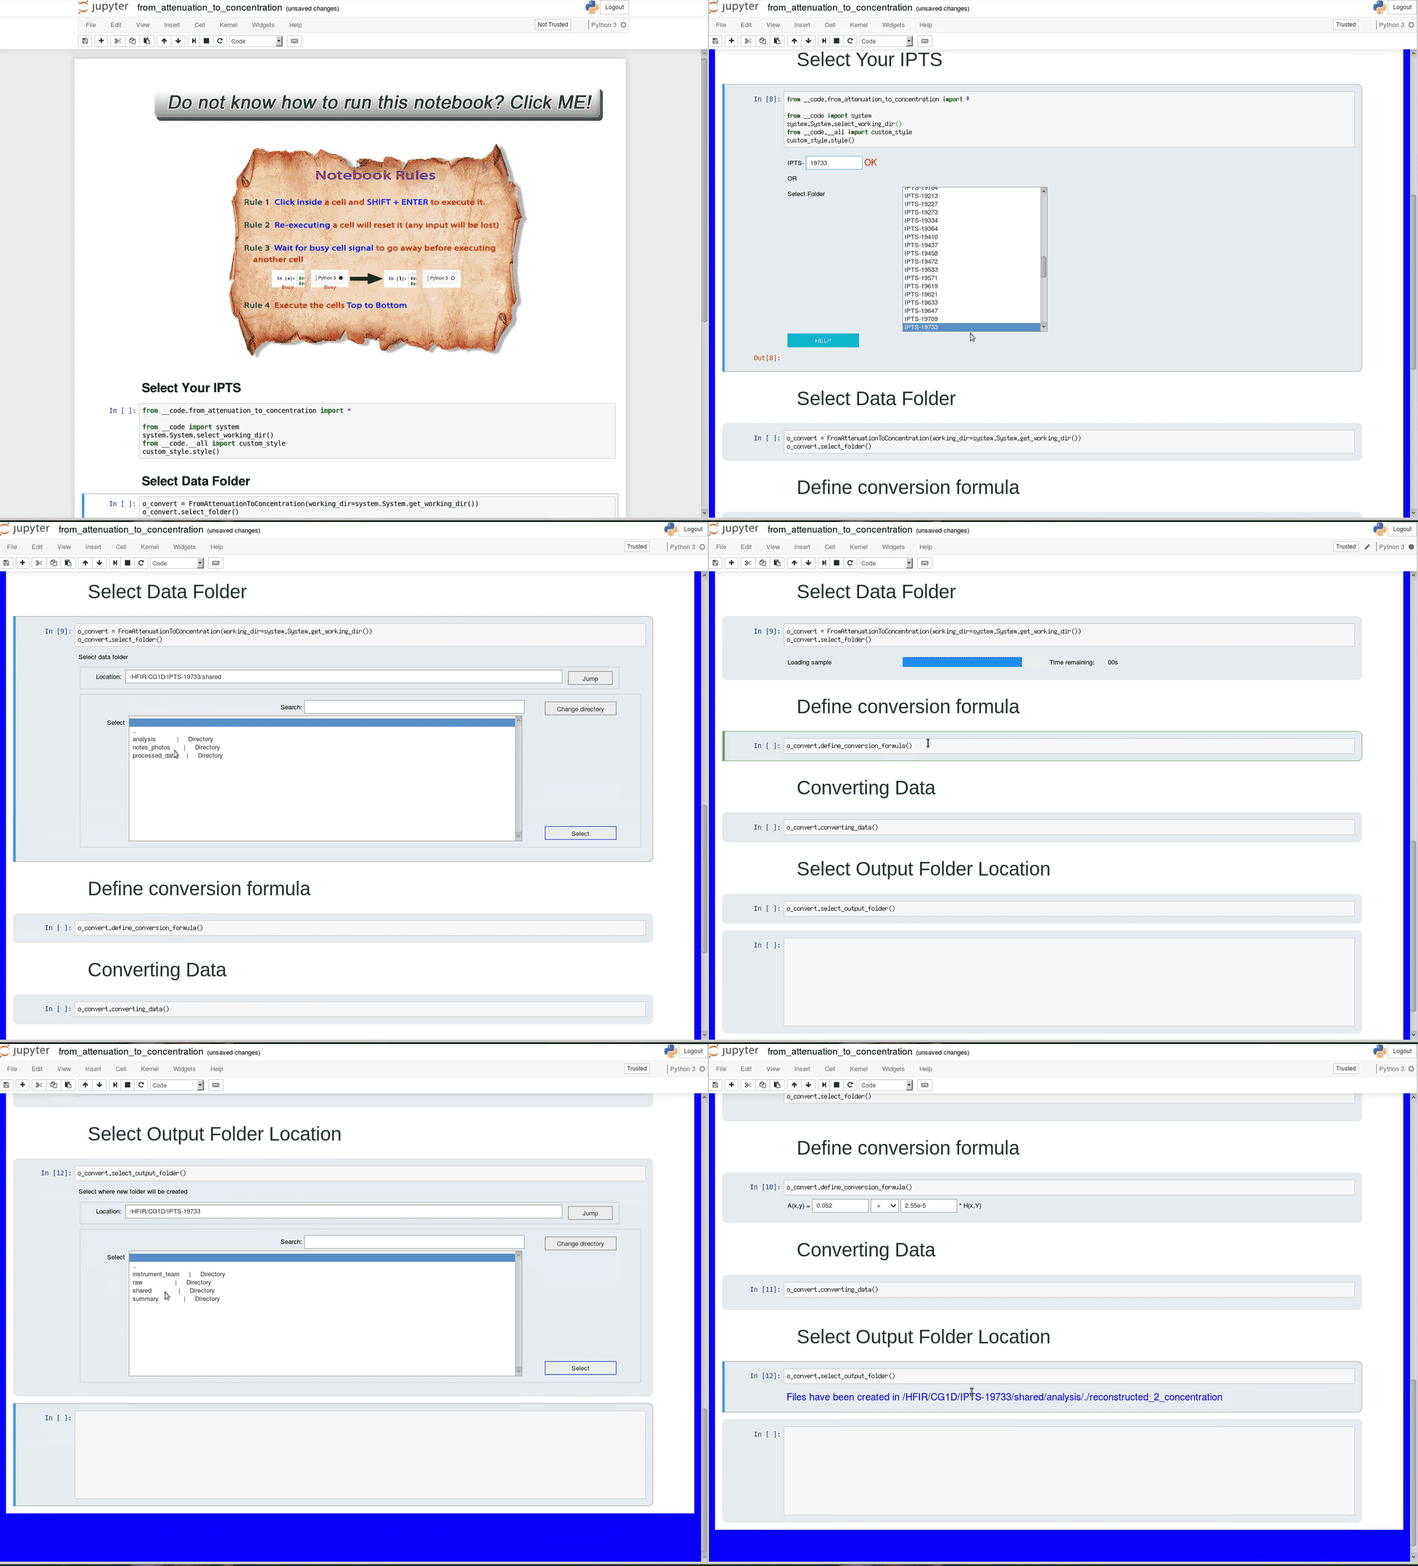
Select your IPTS
Need help using the IPTS selector?
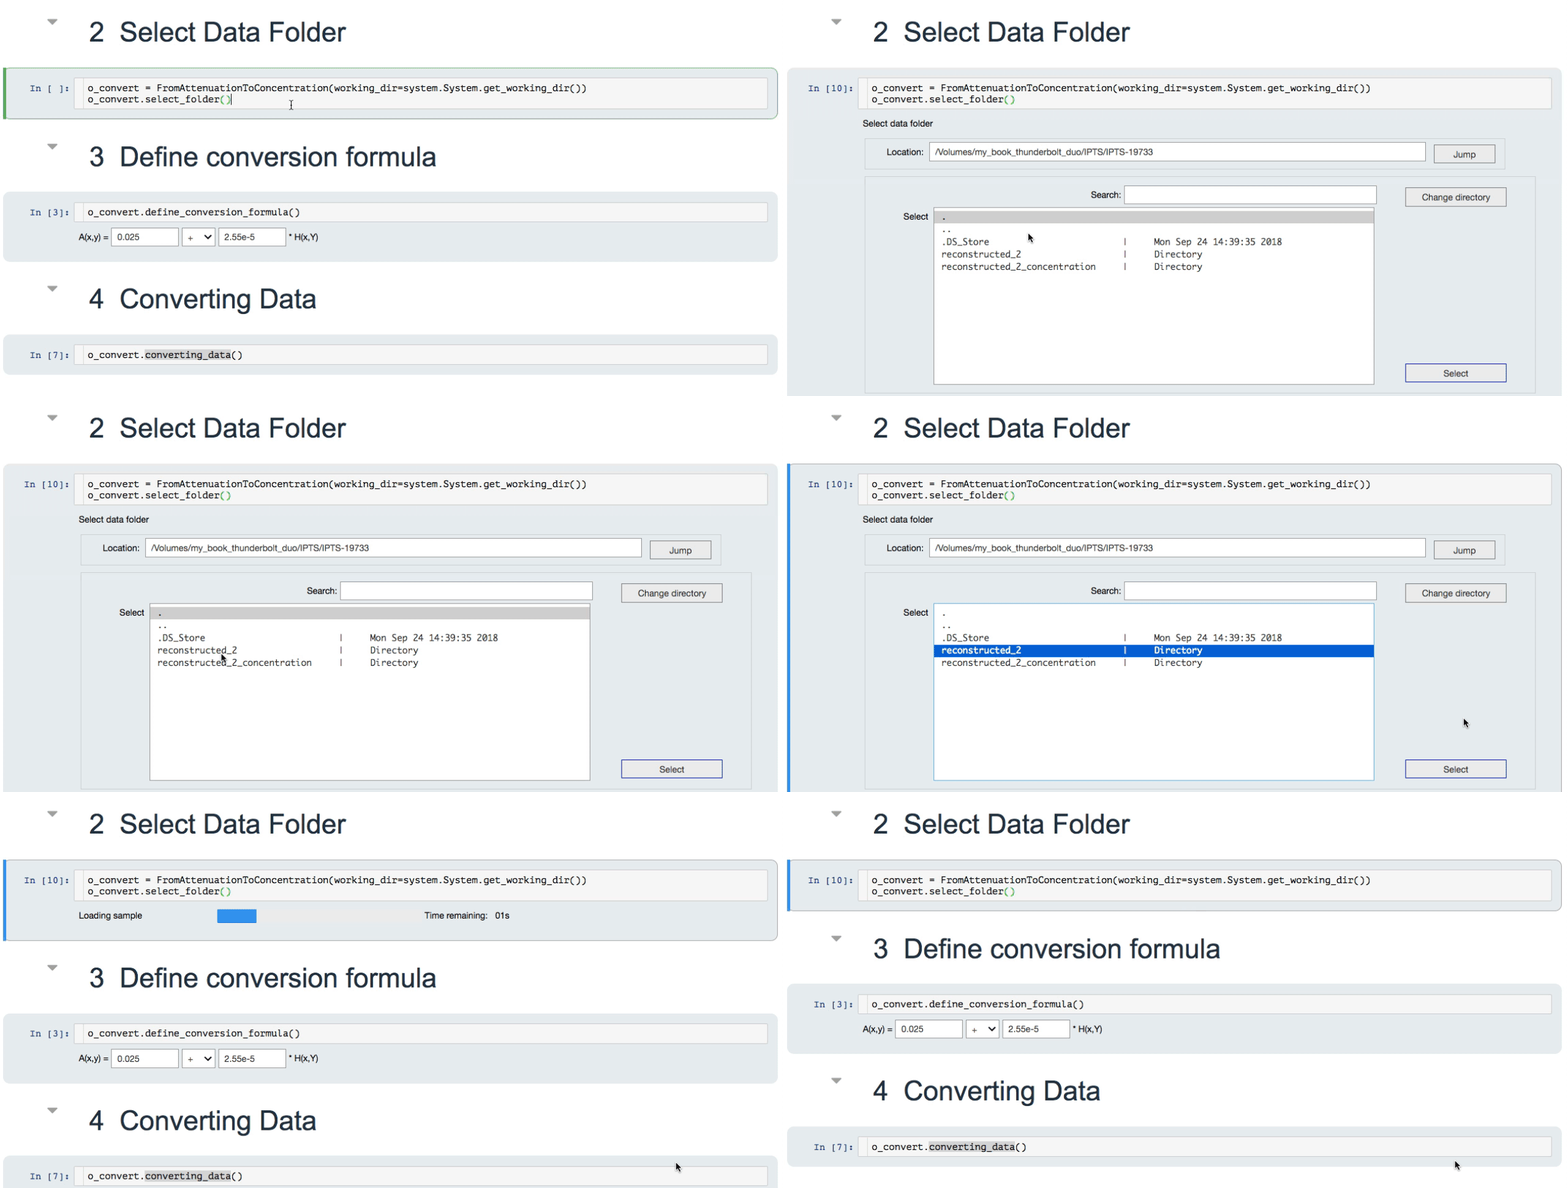
Select data folder
Use the file selection tool to select the folder containing the data.

Define conversion formula
This is where you can define the conversion equation to use
- A(x,y) is the attenuation (normalized) image
- H(x,y) is the concentration array to create

Converting data
Run this cell to convert the data. A progress bar shows you the evolution of the correction.
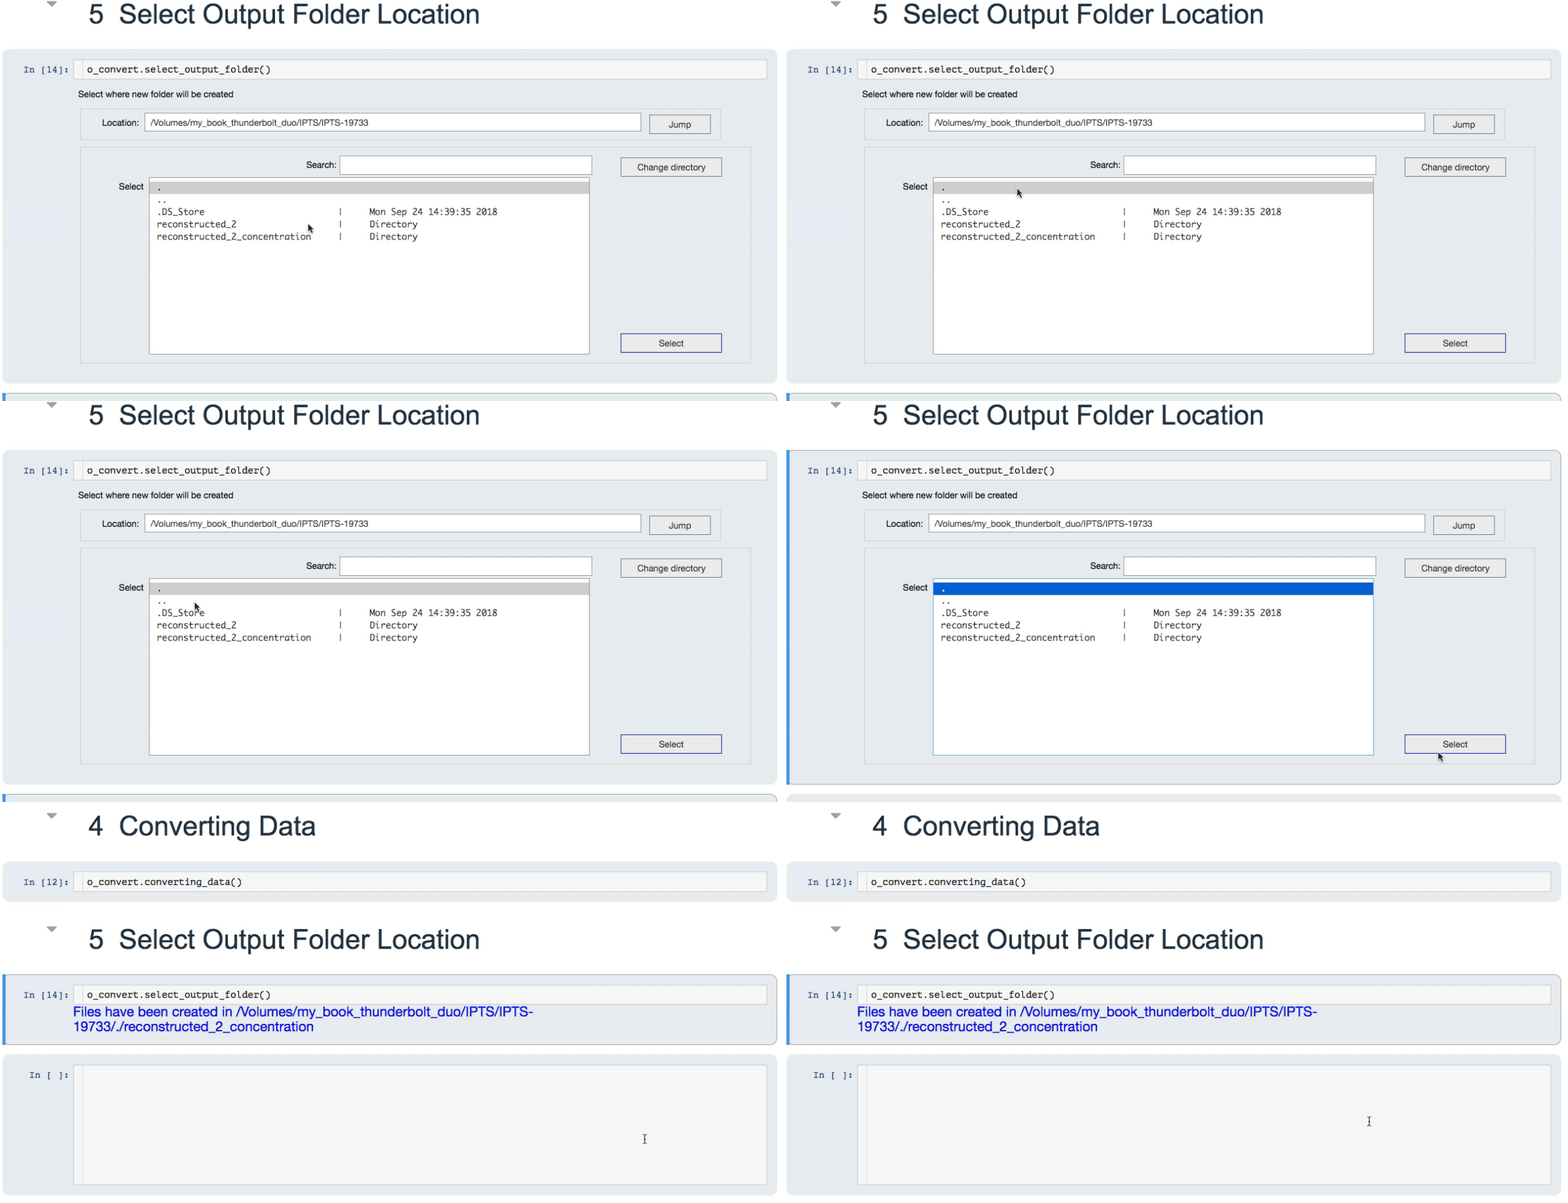
Select output folder
Use the file selection tool to define where you want to export the data. A folder, based on the name of the input folder, will be created as followed
if the input folder is data_03, the output folder will be data_03_concentration

Animation showing the entire process


