HFIR reactor element analysis tool
Description
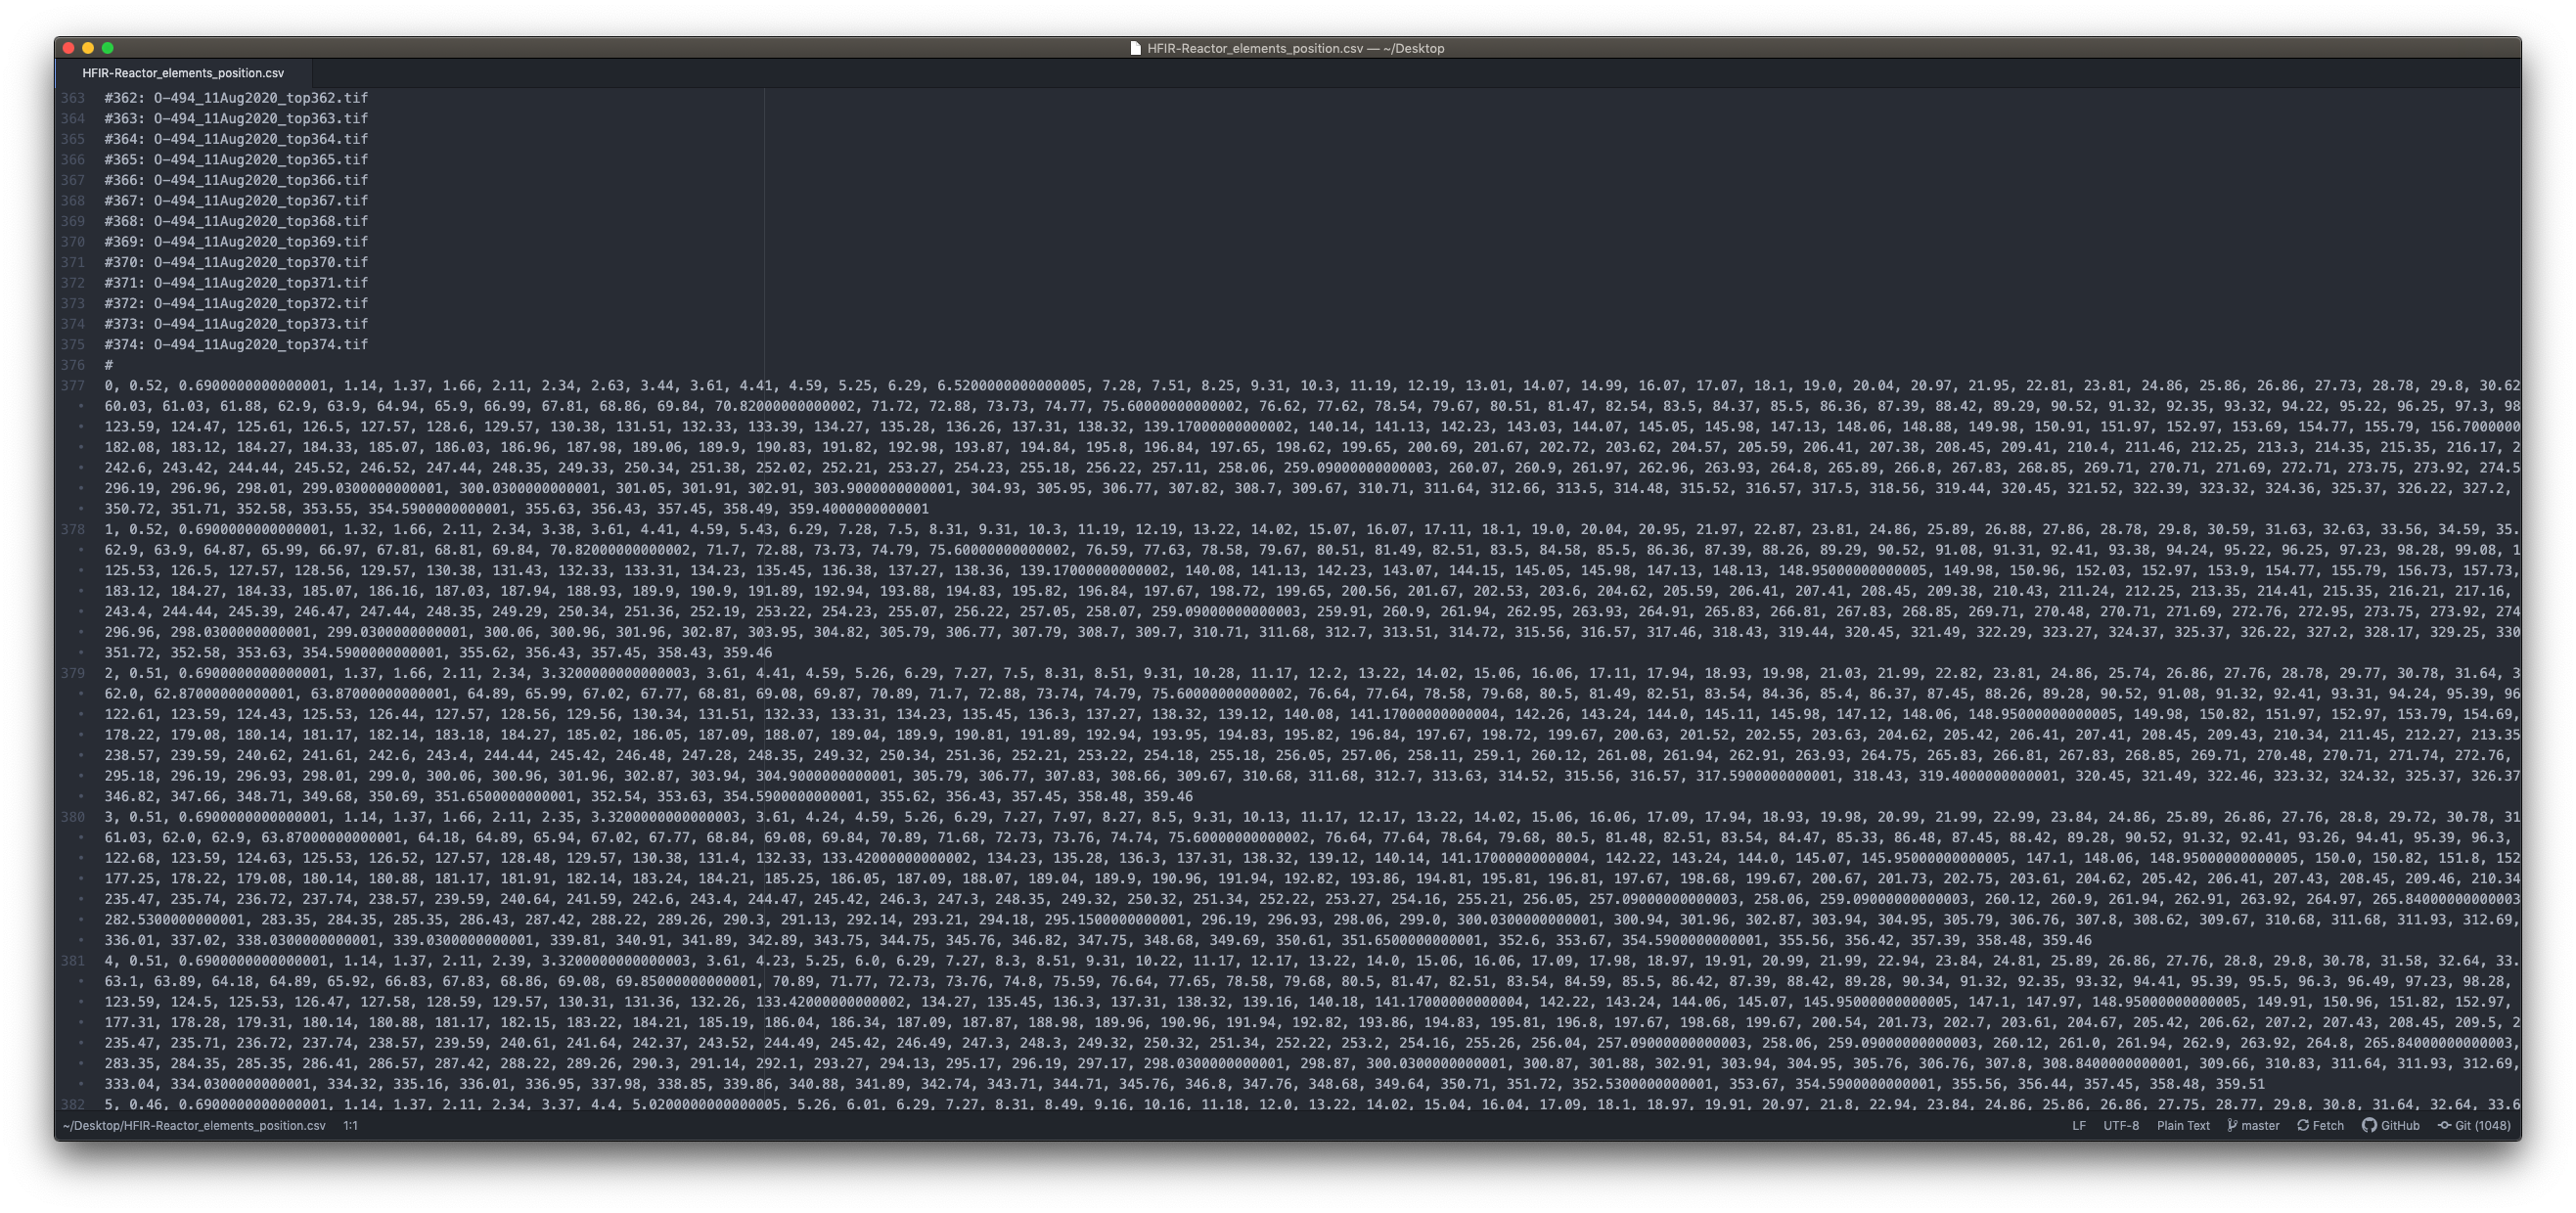
This notebook will use the output ASCII file created by the circular profile of a ring notebook and will display the peak of each element for each file, side by side, to study any displacement of the elements.
Tutorial
Select your IPTS
Need help using the IPTS selector?
Loading the ASCII file
Using the file selection tool, select the profile ASCII file created by the circular profile of a ring notebook.
Launching the user interface
The interface contains 2 tabs. The first tab Profiles will allow you to select the threshold to use to isolate the peaks. The second tab Elements Position will display the position of each peak for each file loaded.
Profiles tab
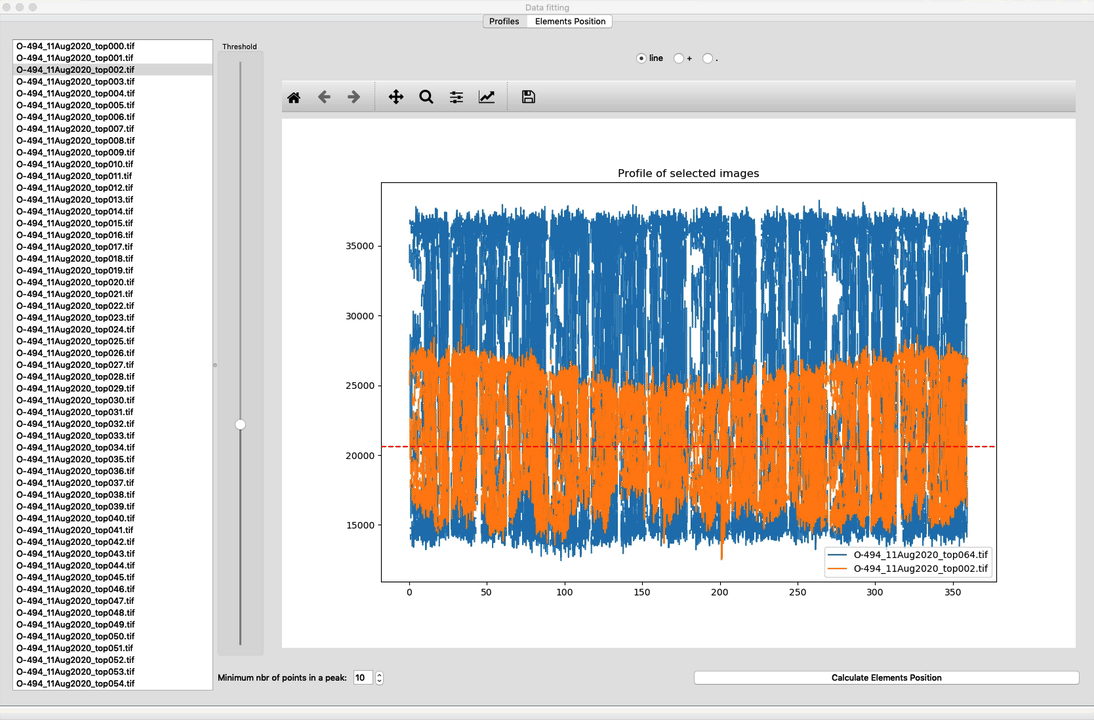
The first thing to do is to visualize the profile of the TIFF file loaded (left table) and remove the rows that do not need to be part of the calculation, for example, the second row selected in the following screenshot.
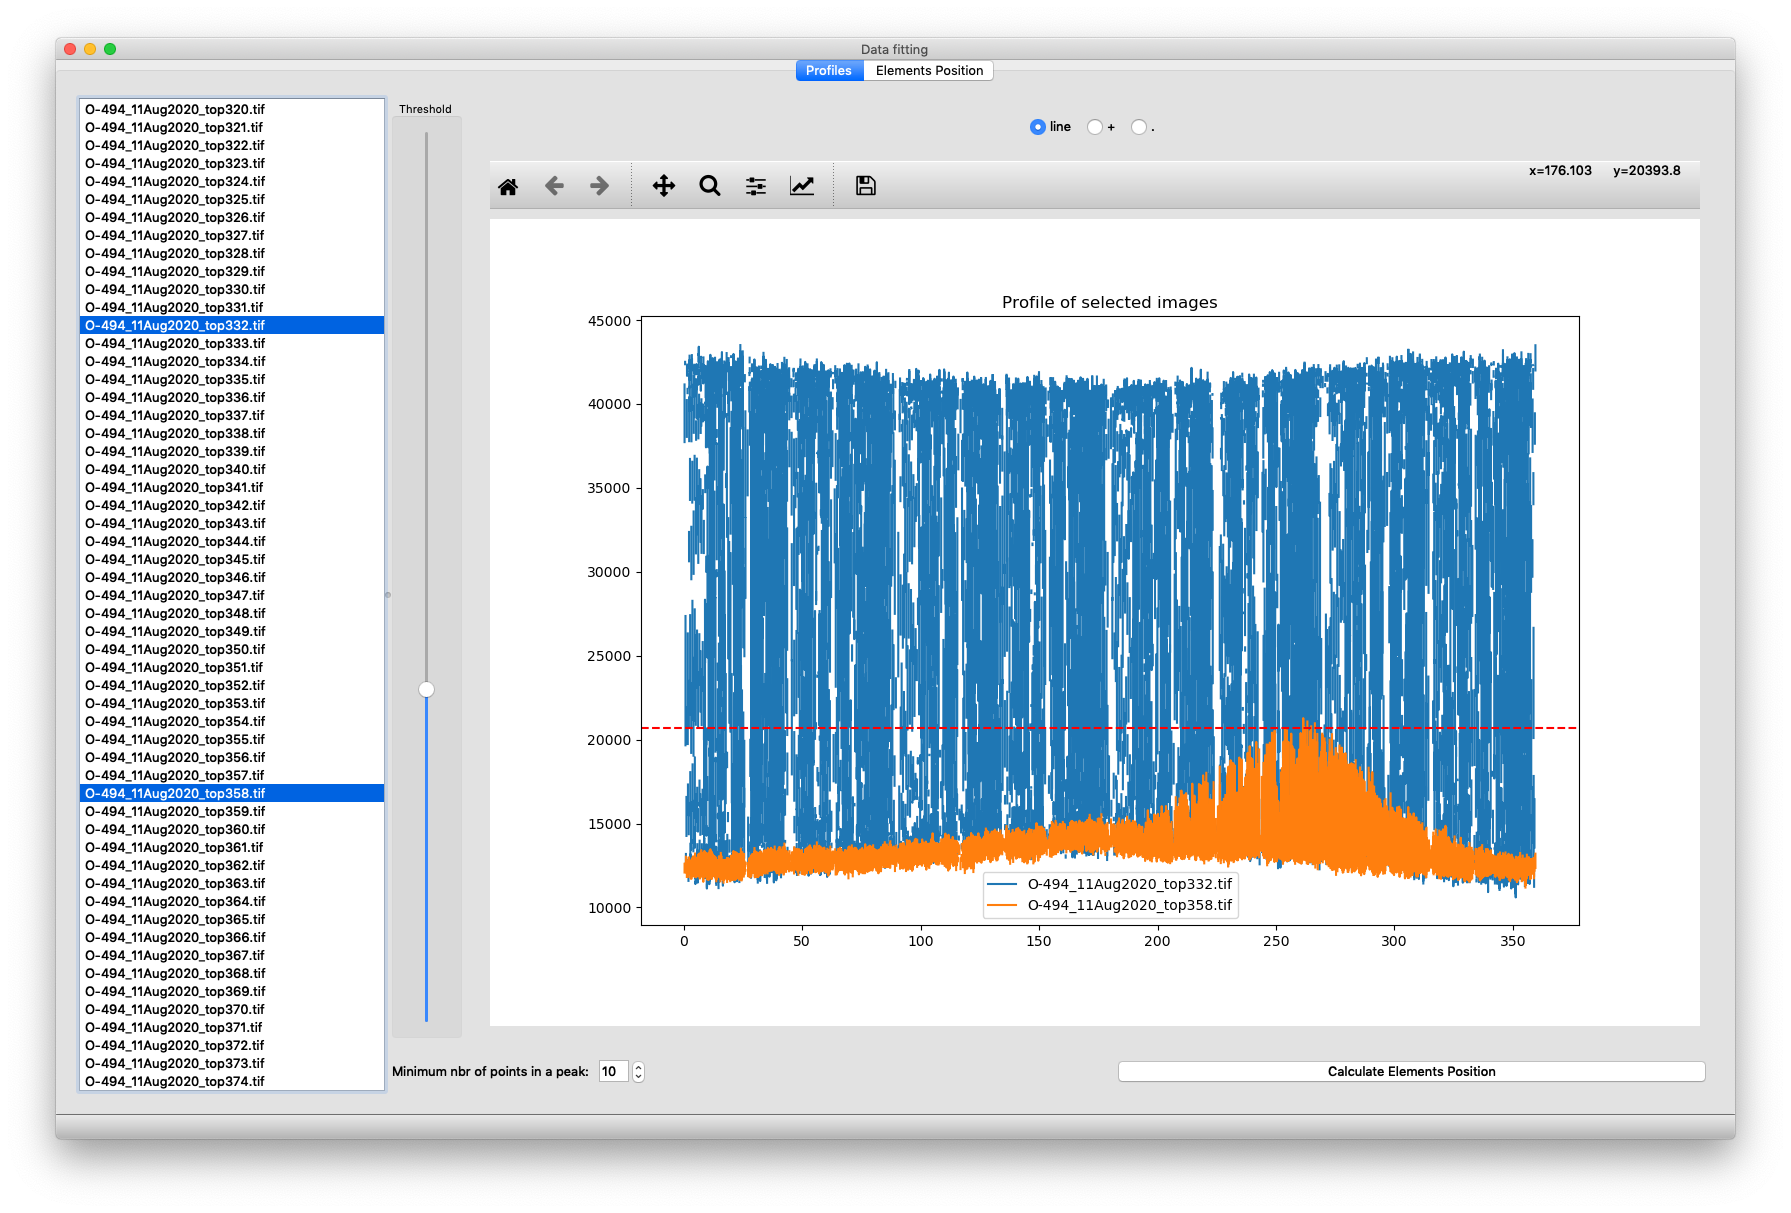
A default threshold has been selected for the data set loaded. Make sure that threshold makes a clear center cut of every single data set to use.
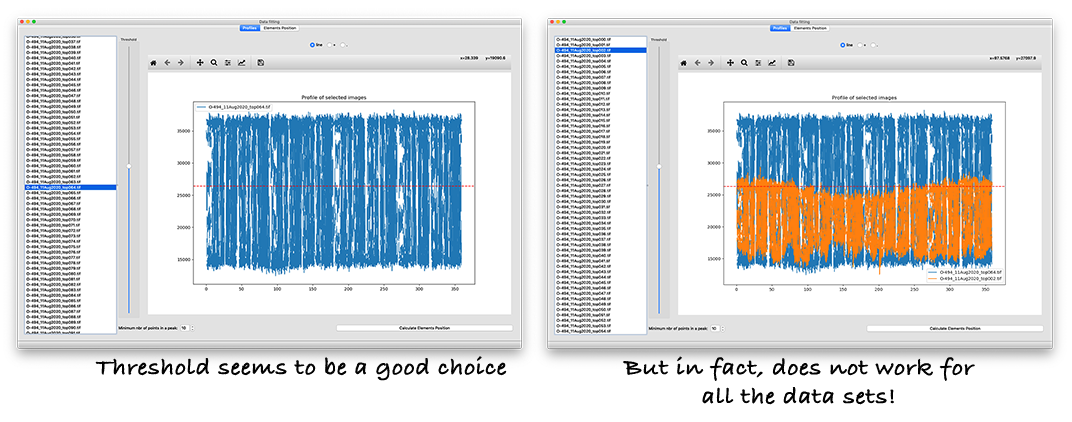
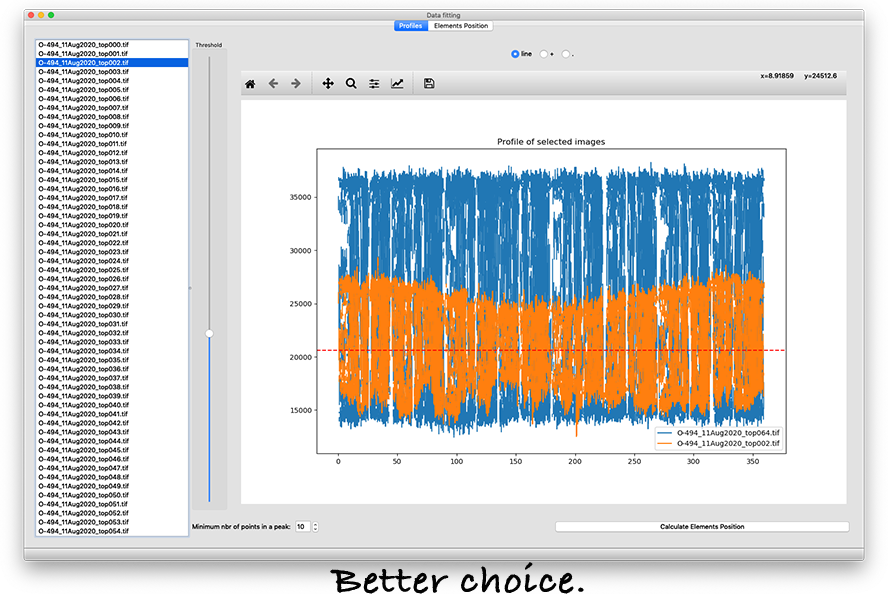
For example, the following examples show what kind of selection to avoid, and then a better one.
Once you are satisfied with the selection, click Calculate Elements Position. The program isolates all the local maximum, representing the center of each element (red symbols).
Make sure you browse through a random list of input data profile files to make sure you don’t see any out-of-position peaks, as shown in the following case.
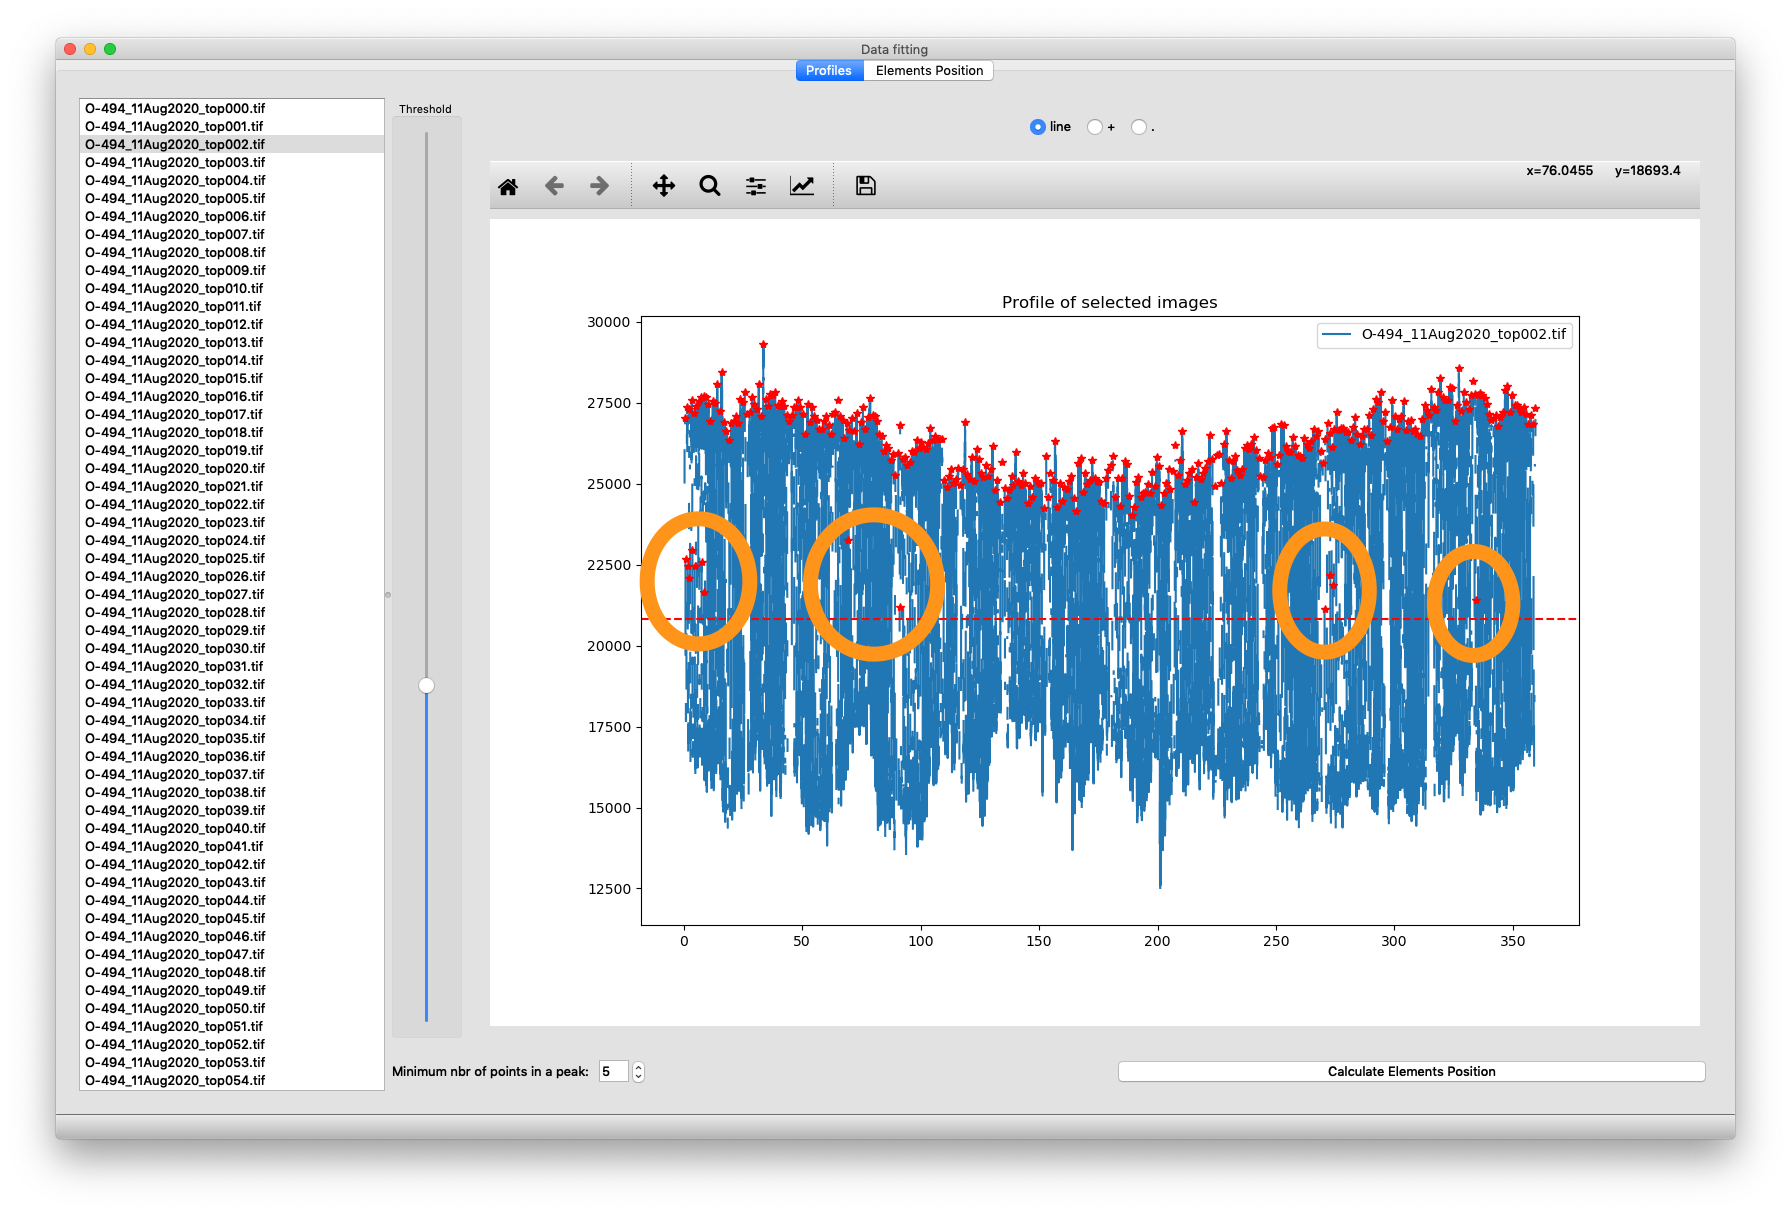
In this case, increase the minimum number of points in a peak number in order to force the program to treat only the real peaks of at least n data points.
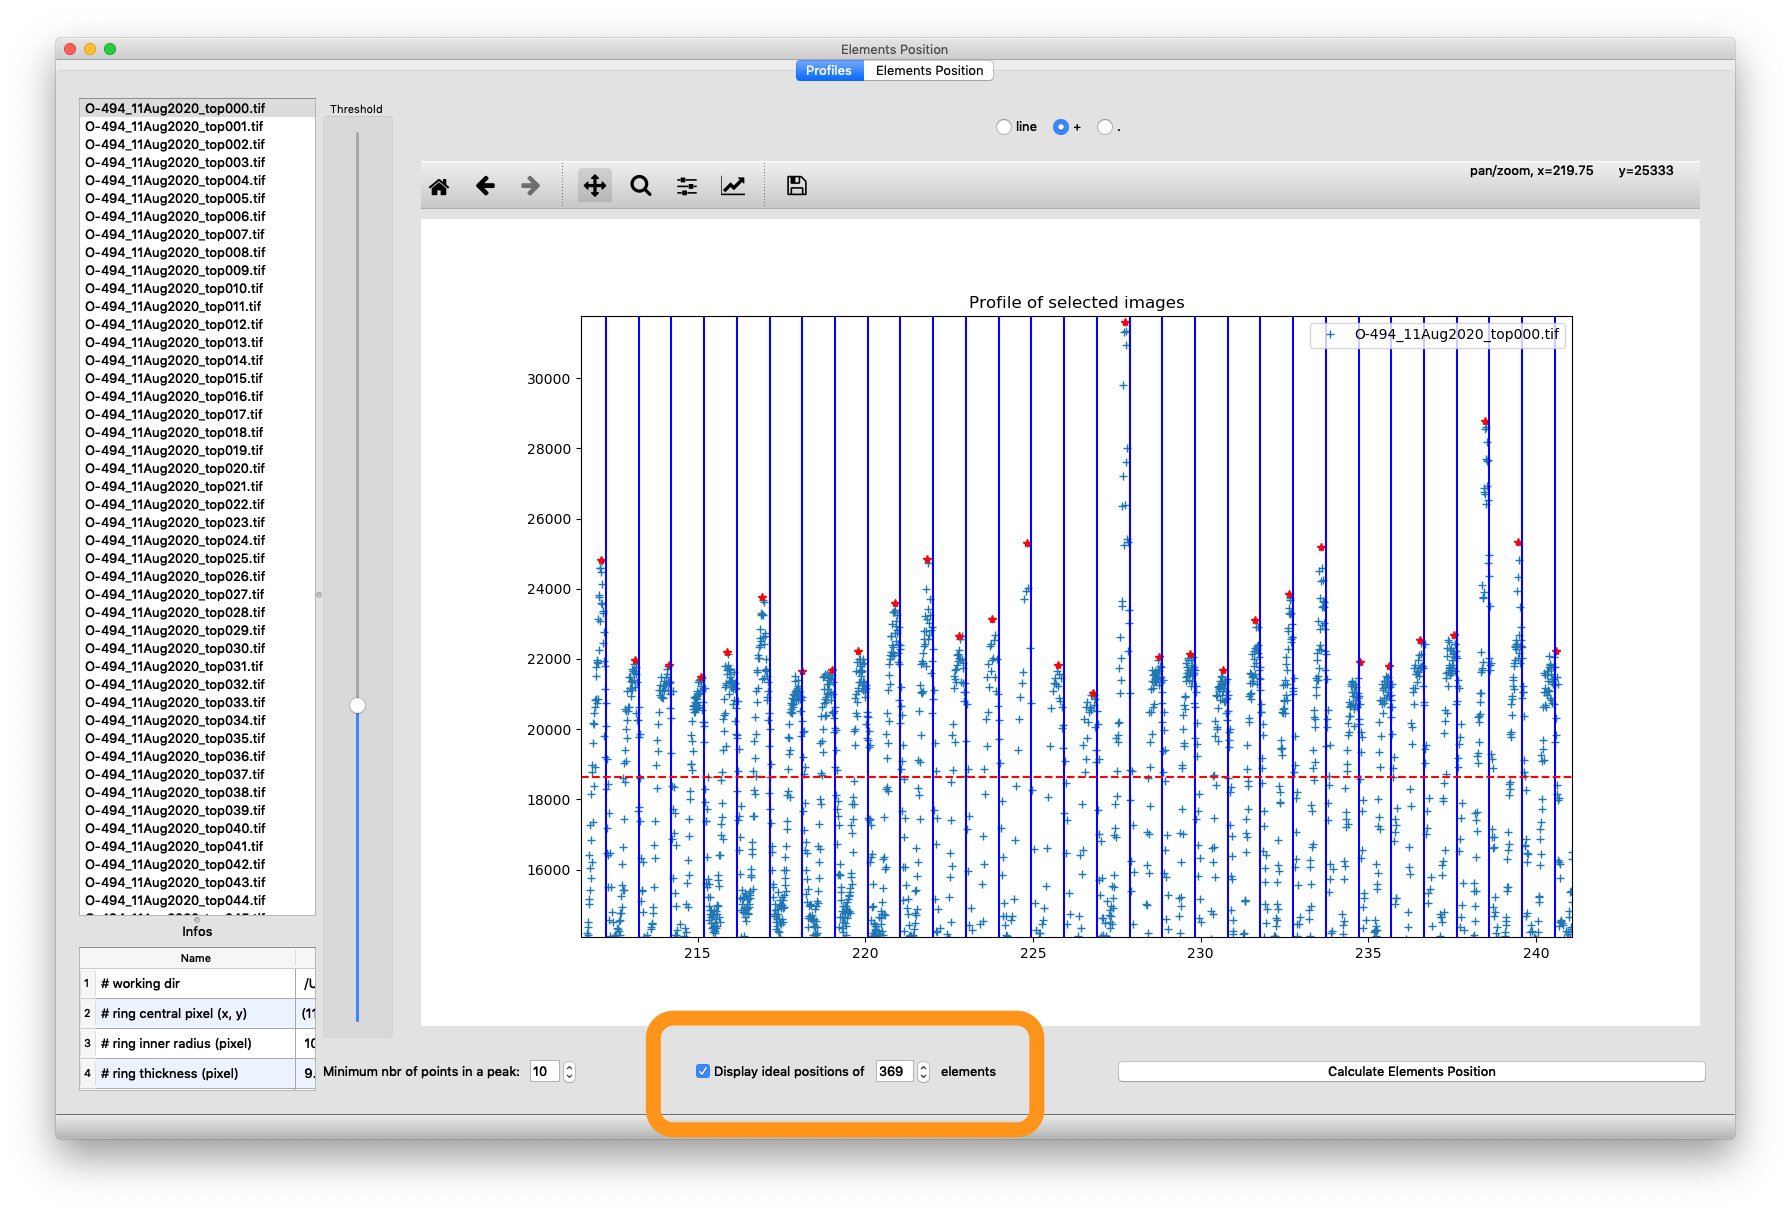
Once the positions of the elements have been calculated, clicking the Display ideal positions of n elements will show in the top plot the ideal positions of those n elements by using the full 360 degrees span starting at the first element found.
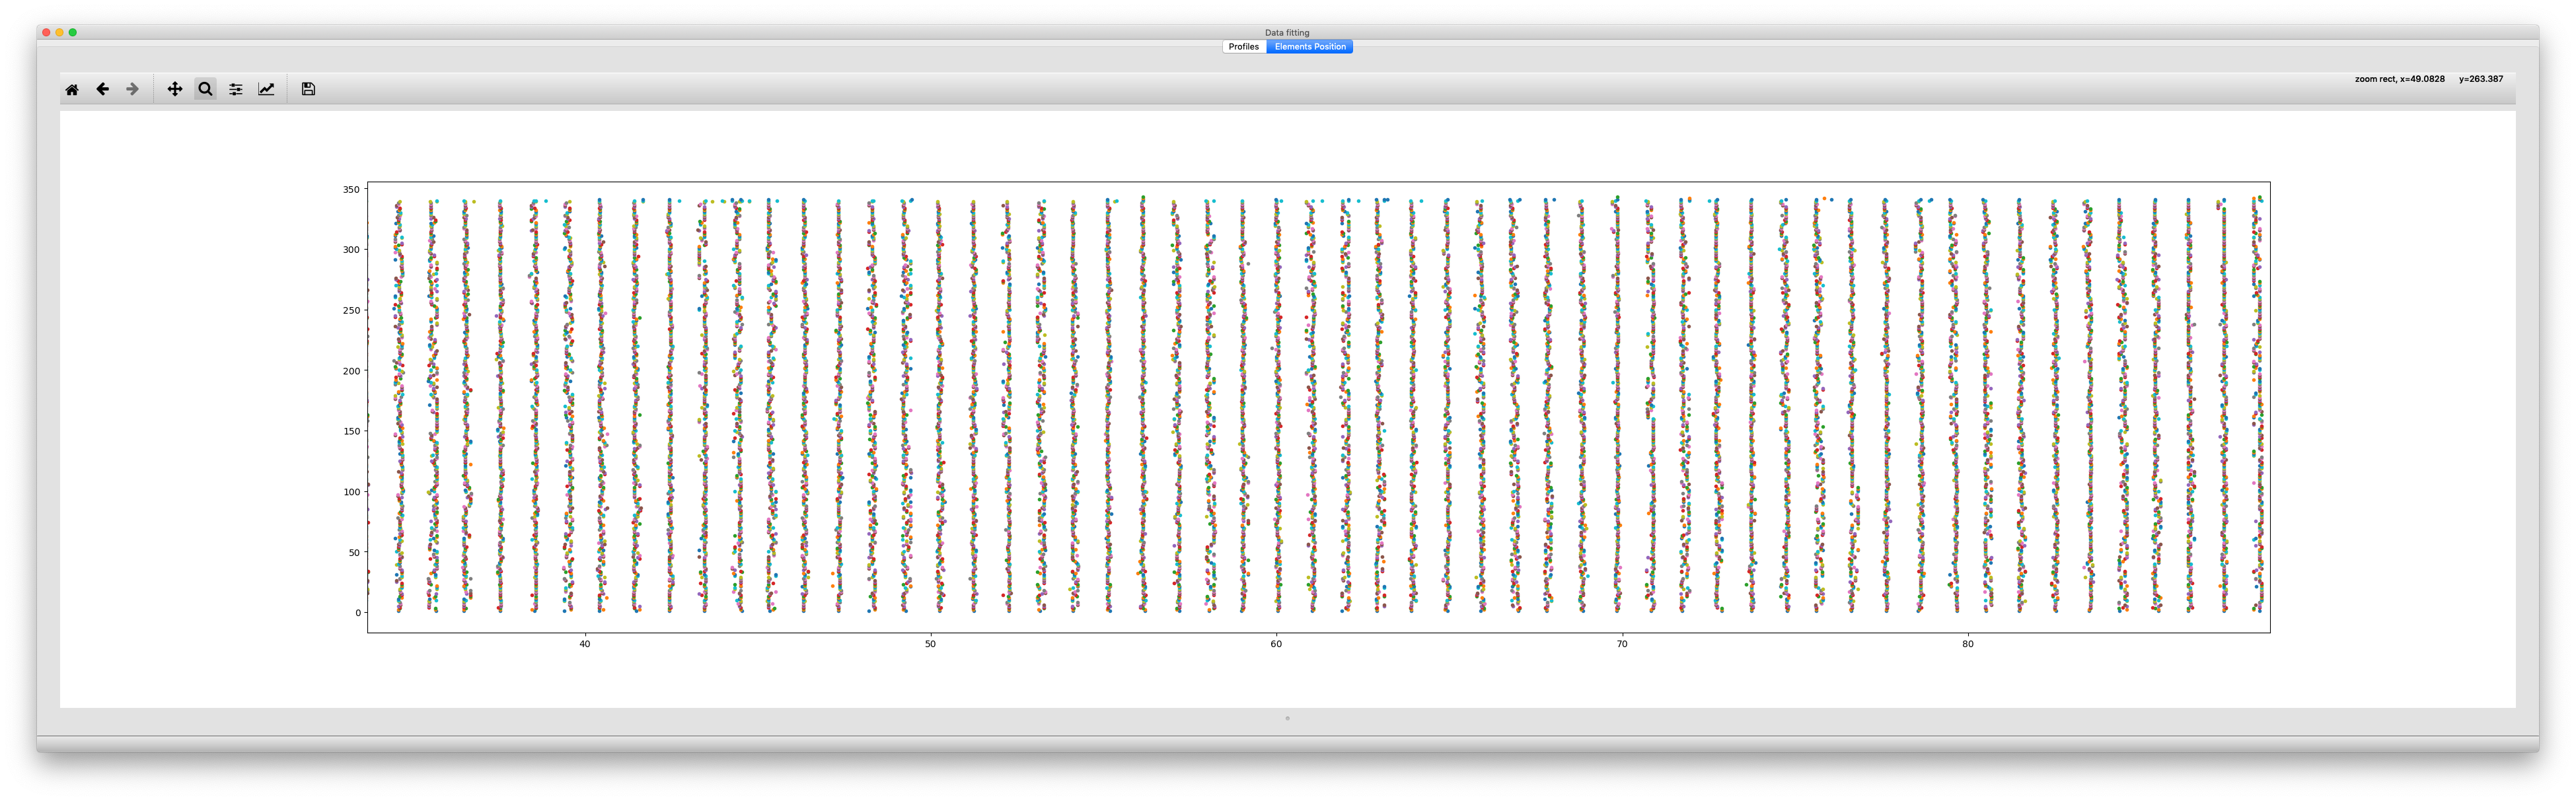
Elements Position tab
This tab displays the peak position of each element for each file. y-axis is the file index and x-axis is the angular position. Zoom in the top plot to really isolate each element and compare their angular position through the slices (projections).
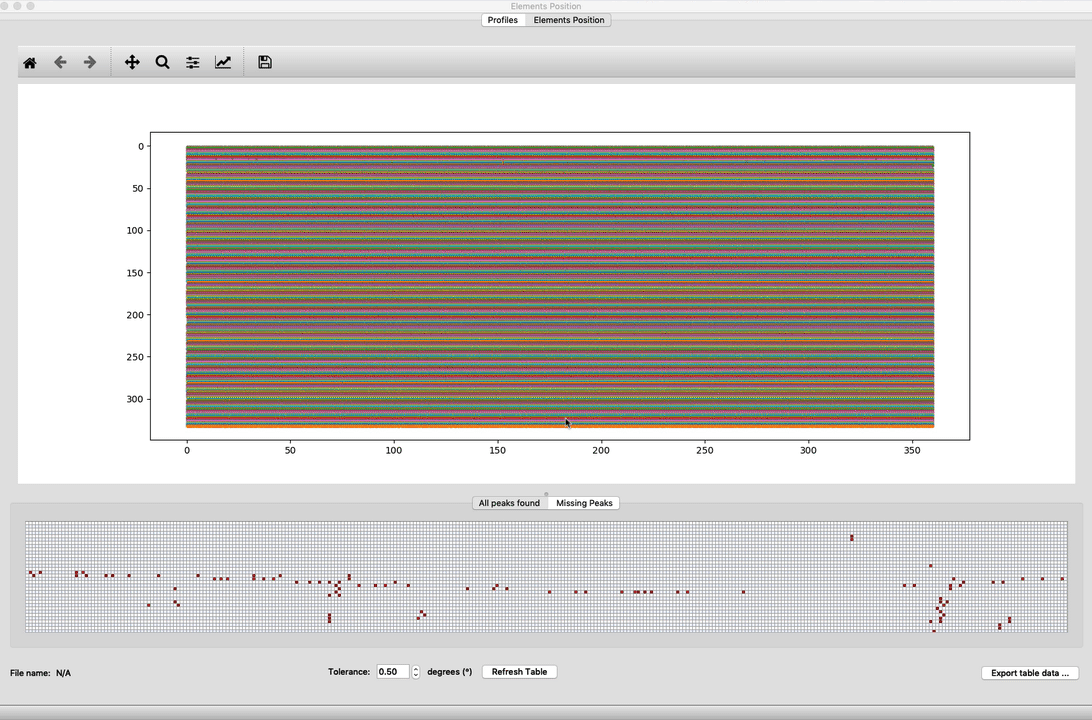
2 tabs are provided at the bottom to quickly locate possible issues.
- all peaks found
- missing peaks
The first tab called all peaks found displays in red the element position that are outside of the tolerance range (defined at the bottom of the window).
The second tab called missing peaks considers the perfect table of the number of files per ideal number of elements and shows in red the elements that have not been located in that particular “ideal” location.
One should starts worrying when the red pattern repeats over multiple images!
Right-click any of the cells of those 2 tables will display the angle value and the corresponding file name.
Export
You can then just export the data into an ASCII data file by clicking the Export table data … button at the bottom right corner.